Inflation Expectations and the Metals

December 20, 2021

[This blog post is an excerpt from a commentary published at TSI last week]

Popular measures of inflation such as the CPI and the PPI are backward looking, but the financial markets are always trying to look forward. To be more specific, current prices in the financial markets are determined by what’s expected to happen in the future as opposed to what happened in the past. An implication is that prices in the financial markets are influenced to a far greater degree by changes in the expected future CPI (inflation expectations) than changes in the reported CPI.

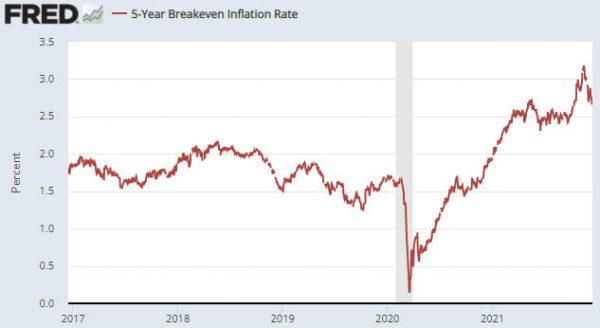
The expected CPI is indicated by the TIPS (Treasury Inflation Protected Securities) market. For example, the following chart shows the expected CPI factored into the price of the 5-year TIPS. According to this measure, the market’s inflation expectations peaked in mid-November and made a 2-month low during the first half of this week.

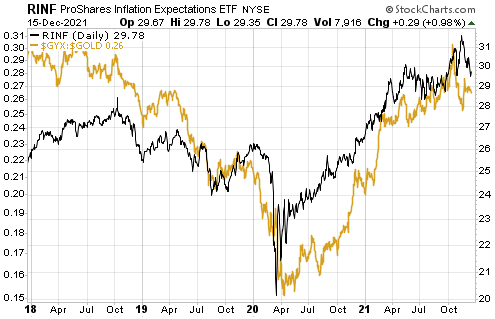
Contrary to the opinions of many commentators on the financial markets, gold tends to underperform the industrial metals when inflation expectations are rising and outperform the industrial metals when inflation expectations are falling. Therefore, if inflation expectations have peaked then the Industrial Metals Index (GYX) should have peaked relative to gold.

The following chart comparison of the GYX/gold ratio and the Inflation Expectations ETF (RINF) shows that GYX peaked relative to gold in mid-October, meaning that the downward reversal in the GYX/gold ratio led the downward reversal in the expected CPI by about one month.

The sustainability of the recent downward reversal in inflation expectations is yet to be determined, but our guess is that it has marked the start of a trend that will continue for 6-12 months or longer. An implication is that it is time to start favouring gold over industrial metals.

The status of gold’s “true fundamentals”

December 7, 2021

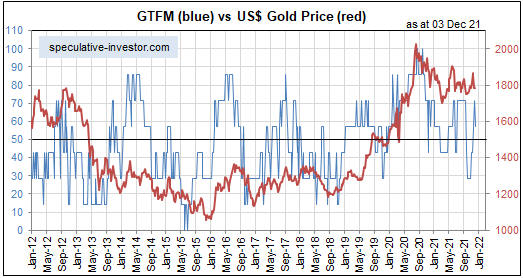
According to my Gold True Fundamentals Model (GTFM), the gold market’s fundamentals were bullish or trending positively from early-November of 2019 through to late-September of 2020 and were bearish or trending negatively from early-October of 2020 through to late-October of this year. As illustrated by the blue line on the following weekly chart, they turned upward in early-November and are now in bullish territory, albeit only slightly. Does the recent upturn constitute a major shift or a countertrend move within an overall environment that remains bearish for gold?

Before attempting to answer the above question, it is worth reiterating that I use the term “true fundamentals” to distinguish the fundamentals that actually matter from the largely irrelevant issues that many gold-market analysts and commentators focus on.

According to many pontificators on the gold market, gold’s fundamentals include the volume of metal flowing into the inventories of gold ETFs, China’s gold imports, the amount of “registered” gold at the Comex, India’s monsoon and wedding seasons, jewellery demand, the amount of gold being bought/sold by various central banks, changes in mine production and scrap supply, changes in the money supply and the CPI, and wild guesses regarding the activities of bullion banks. These things are distractions at best. For example, a gold investor/trader could have ignored everything that has been written over the past 20 years about the amount of gold in Comex warehouses and been none the worse for it.

On an intermediate-term (3-18 month) basis, there is a strong tendency for the US$ gold price to trend in the opposite direction to confidence in the US financial system and economy. That’s why most of the seven inputs to my GTFM are measures of confidence. Two examples are credit spreads and the relative strength of the banking sector. The model is useful, in that over the past two decades all intermediate-term upward trends in the gold price occurred while the GTFM was bullish most of the time and all intermediate-term downward trends in the gold price occurred while the GTFM was bearish most of the time.

However, upward corrections can occur in the face of bearish fundamentals and downward corrections can occur in the face of bullish fundamentals. For example, there was a substantial downward correction in the gold market in March of 2020 in the face of bullish fundamentals. Such corrections often are signalled by sentiment indicators.

Getting back to the question posed in this post’s opening paragraph, I suspect that we are dealing with a countertrend bullish move within an overall environment that remains bearish for gold. The reason is that although a couple of small cracks have appeared in the superficially-positive economic picture over the past few weeks, the preponderance of evidence still indicates that the US economic boom (monetary-inflation-fuelled increase in economic activity) is intact.

Major gold rallies occur during the economic bust and boom-to-bust transition phases of the long-term cycle. By the same token, gold tends to fare poorly, especially relative to the broad stock market and industrial commodities, during the boom phases of the long-term cycle. While the boom remains intact, the best that can be reasonably expected from gold is a multi-month rebound within a trading range or a long-term downward trend.

Boom-Bust Cycle Update

November 23, 2021

In a 9th November blog post I wrote that the US TMS (True Money Supply) growth rate had fallen far enough to suggest that the next trend reversal in credit spreads from narrowing to widening would mark the start of a boom-to-bust transition rather than just an interruption to the boom. What’s the current situation?

Before answering the above question it’s worth reiterating that a trend reversal in credit spreads (from narrowing to widening) isn’t the only early warning that a boom-to-bust transition has begun for the US economy. As mentioned in previous blog posts (for example, HERE), another necessary signal is pronounced weakness in the Industrial Metals Index (GYX) relative to the gold price. In other words, prior to the end of a boom* there will be upward trend reversals in credit spread indicators such as the US High Yield Index Option-Adjusted Spread (HYIOAS) and a downward trend reversal in the GYX/gold ratio. As an aside, the most recent bust began in early-October of 2018 and ended in early-June of 2020.

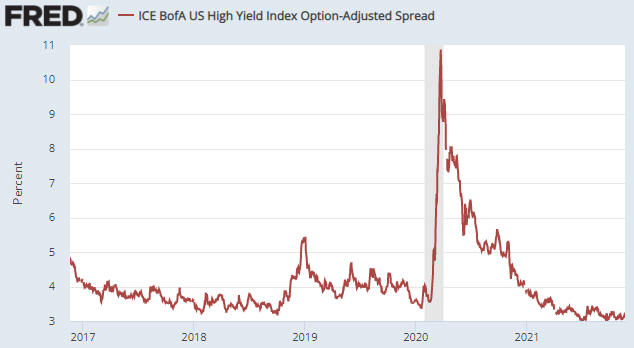
The following daily chart shows the HYIOAS.

In early-July of this year the HYIOAS was at its lowest level in more than 10 years and not far from an all-time low. It spiked upward around the middle of July and then returned to near its low, where it remains (it ended last week at around 3.2%).

Note that a credit-spread reversal would be signalled by the HYIOAS making a higher short-term high AND moving back above 4%. The first of these criteria (the initial warning) would be triggered by a move above 3.5%.

HYIOAS_231121

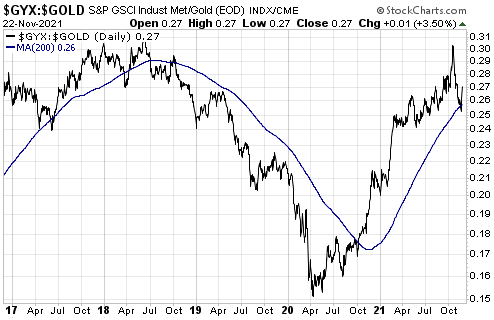
The next chart shows the GYX/gold ratio. To generate a boom-to-bust warning the line on this chart would have to make a sustained break below its 200-day moving average.

GYX_gold_231121

Neither of the indicators that in the past have always warned prior to the start of a boom-to-bust transition for the US economy has triggered, although it would not take much additional weakness in GYX relative to gold for the GYX/gold ratio to generate a warning signal. This implies that the US economic boom that began during the second quarter of 2020 is intact. Furthermore, as things currently stand it looks like the start of a boom-to-bust transition is still at least a few months away.

*An economic boom is a period of generally rapid economic activity fuelled by monetary inflation. It does not necessarily involve sustainable economic progress. In fact, most of the apparent gains achieved during the boom tend to be relinquished during the subsequent bust.

Reconciling high “inflation” and low bond yields

November 16, 2021

[This blog post is a slightly modified excerpt from a TSI commentary published last week]

The US government just reported a 6.2% year-over-year increase in the CPI (refer to the following chart). This was the largest increase since 1990 and the second-largest increase since 1982. Furthermore, nobody in their right mind believes that the CPI overstates the pace of US$ depreciation. How can this be happening in parallel with a yield of about 1.5% on the US 10-year T-Note and a yield of about 1.9% on the US 30-year T-Bond?

There’s a two-part answer to the above question, the first part of which is that the bond market expects the CPI to average only 2.7% over the next ten years. We know this is the case because 2.7% is the annual CPI increase factored into the current price of the 10-year TIPS. In other words, the bond market is anticipating a substantial pullback in the “inflation” rate from its current level. However, even a 2.7% rate of increase in the CPI is inconsistent with a current 10-year T-Note yield of around 1.5%. Based on today’s inflation expectations, the 10-year T-Note currently should be yielding at least 3.5%.

The other part of the answer is that the financial markets expect the Fed to do whatever it takes to cap the yields on US government bonds at well below the rates that would be consistent with the official “inflation” rate.

Given its unlimited ability to purchase assets with money that it creates out of nothing, the Fed is capable of keeping government bond yields pegged at unrealistically low levels for a long time. However, doing so would have very bearish implications for the US$ and very bullish implications for most US$-denominated prices. In particular, Fed policy that involved capping US government bond yields at low levels in the face of obvious evidence of high “inflation” would be extremely bullish for the US$ gold price.

Official Fed policy that involves capping bond yields at low levels in the face of persistently high “inflation” is not likely to be introduced over the next six months, but I suspect that it will become a major driver of market prices during 2023-2024.