Print This Post Print This Post

Gold and the ‘Real’ Interest Rate

May 24, 2022

[This blog post is an excerpt from a commentary published at TSI last week]

One of the few commonly-believed things about gold that is actually true is that gold tends to become more valuable when the real interest rate is trending downward and less valuable when the real interest rate is trending upward. Furthermore, although the real interest rate trend is just one of seven inputs to our Gold True Fundamentals Model (GTFM) and usually doesn’t have a greater effect than the other inputs, over the past three months it clearly has been the dominant fundamental influence on the US$ gold price. This prompted us to ask: Have there been times in the past when the change in the real interest rate trumped all other considerations?

Before we answer the above question we’ll reiterate a point we’ve made numerous times in the past, which is that the only way to get an accurate read on the real US interest rate trend is via the yields on Treasury Inflation Protected Securities (TIPS). Unfortunately, the TIPS market did not exist prior to 2003, so there is no way of measuring the performance of real interest rates during earlier periods. In particular, it would be extremely useful to know the performance of real interest rates during the 1970s (the last time that “inflation” was widely viewed as “Public Enemy No. 1”), but the information simply isn’t available. It is tempting to calculate the real interest rate that prevailed in earlier periods by using what is available, for example, by subtracting the year-over-year change in the CPI from the nominal interest rate. However, you can’t make up for the lack of a legitimate number by using a bogus one.

As far as we can tell, during the 19.5 years since the TIPS market came into being there has been only one other multi-month period when the real interest-rate trend caused a sizable move in the gold price that was counter to the overall fundamental backdrop. That period was March-October of 2008, which is the first of the three real interest rate (10-year TIPS yield) surges labelled on the following chart. During March-October of 2008 the overall fundamental backdrop was supportive for gold, but the real interest rate rise was large enough and fast enough to trump the bullish influences on the US$ gold price.

By the way, the second of the three real interest rate surges labelled on the chart occurred during April-September of 2013. This one doesn’t qualify because it occurred when economic growth expectations were rising and the overall fundamental backdrop was bearish for gold.
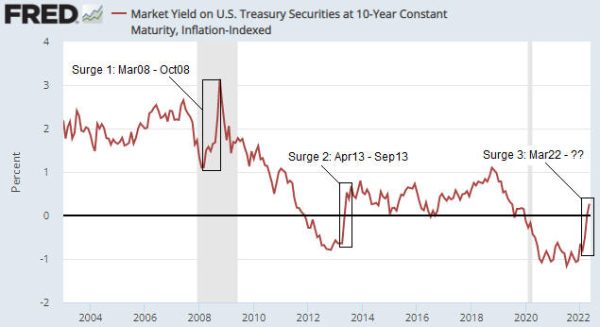
Like the real interest rate surge during March-October of 2008, the one that began on 8th March of this year has occurred in parallel with collapsing economic growth expectations. The difference is that whereas the 2008 surge in the TIPS yield was driven by plunging inflation expectations, the 2022 surge has been driven by rising nominal interest rates.

Despite the overall gold-bullish fundamentals, in 2008 the US$ gold price remained in a downward trend until the TIPS yield peaked. Gold then quickly retraced its decline and gold mining stocks sprang back like beachballs that had been held underwater. Based on the way things are going it is likely that something similar will happen this year.

Print This Post Print This Post

Putin’s Price Hike

May 15, 2022

[This blog post is a brief excerpt from a TSI report published last week]

Central banks and governments rarely, if ever, take responsibility for obvious inflation problems. They never have to, because by the time an inflation problem becomes obvious a lot of time will have transpired since the implementation of the policies that caused it. Furthermore, due to the aforementioned time between cause and effect it generally will be possible for policymakers to point the finger of blame at external influences from the more recent past. A great example is the Biden Administration’s references to the current US inflation problem as “Putin’s price hike”.

The foundation for today’s inflation was laid many years ago by a central bank that reacted to every bout of serious economic and/or stock market weakness by pumping up the money supply, but it was in 2020 that ‘the rubber hit the road’ so to speak. Beginning in March of 2020, this is what happened:

1) The government shut down large sections of the economy in reaction to a pandemic. This was a heavy-handed, low-tech and short-sighted political decision that gave scant consideration to the collateral damage it would cause to both the economy and public health. Unfortunately, an economy isn’t like an engine that can be stopped and then restarted with no ill effects. On the contrary, many supply chains will be permanently broken when large sections of the economy are shut down. Establishing new supply chains often will take time (at least several months and perhaps even years), and in the interim there will be shortages.

2) The government-driven economic collapse prompted the Fed to create several trillion new dollars out of nothing, thus expanding the total US money supply by 40% in one year. This is the single most important contributor to the current inflation problem, and yet the Fed generally is portrayed as the solution to the problem rather than the primary cause of it.

3) To mitigate the extreme short-term hardship caused by its own actions, the government distributed to individuals and businesses a substantial portion of the new money created by the Fed. In effect, the government showered the population with money, and as a result the 2020 recession coincided with a rapid increase in personal income. Nothing like this had ever happened before.

Summing up the above, as part of a reaction to COVID-19 the government caused the supply of many goods to shrink, and at the same time the government teamed up with the Fed to engineer a large increase in the monetary demand for goods. This created an obvious “inflation” problem well before Russia invaded Ukraine.

The major inflation problem that existed prior to Russia’s invasion of Ukraine has since become worse, but not due to the invasion itself. Russia’s invasion of Ukraine could not have made a significant difference to inflation in the US or in most other parts of the world if not for the economic sanctions imposed against Russia. The sanctions have added to the problem.

The anti-Russia sanctions have done new damage to supply chains and deprived the world of critical resources, but to what end? Economic sanctions have never worked in the past and there is no reason to expect that this time will be different. In fact, the evidence to date indicates that the sanctions have not only done nothing to help innocent Ukrainians or discourage the perpetrators of the war (in Russia, Putin is now more popular than ever), but also caused hardship for innocent people throughout the world.

In conclusion, the current US inflation problem was caused by the combination of a huge increase in the US money supply, US government programs that effectively showered the population with money, supply disruptions caused by COVID-related lockdowns and additional supply disruptions caused by a raft of anti-Russia sanctions that have no chance of achieving anything positive. That is, the “inflation” that has become the primary focus of US policymakers is the result of domestic US policy choices. Therefore, calling it “Putin’s price hike” is disingenuous to put it mildly.

Print This Post Print This Post

US monetary inflation and boom-bust update

May 2, 2022

[This blog post is an excerpt from a TSI commentary published last week]

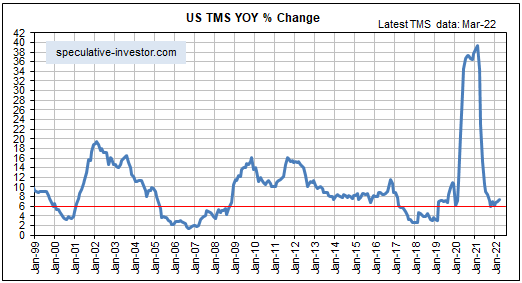
The phenomenal rise in the US monetary inflation rate from early-2020 to early-2021 set in motion an economic boom. There remains some doubt as to whether the boom is over, but the weight of evidence indicates that it probably is.

Booms contain the seeds of their own destruction, meaning that a painful economic bust becomes inevitable after there has been sufficient monetary inflation to foster a boom. Usually, the boom begins to unravel after the pace at which new money is being created (loaned into existence by commercial banks and/or electronically ‘printed’ by the central bank) drops below a critical level, but note that the bust phase cannot be postponed indefinitely by maintaining a rapid level of money-supply growth. On the contrary, an attempt to keep the boom going via an ever-increasing pace of money creation will cause the eventual bust to be the hyper-inflationary kind, which is the worst kind because it crushes the prudent along with the imprudent.

Over the past few decades a boom-to-bust transition for the US economy didn’t begin until after the monetary inflation rate (the year-over-year True Money Supply (TMS) growth rate) dropped below 6%. However, due to the structural damage to the economy resulting from the Fed’s manipulations of money and interest rates over many decades and especially over the past decade, it’s possible that this time around a bust will begin with the monetary inflation rate at a higher level than in the past. That is, even though the latest money-supply figures* reveal that the year-over-year TMS growth rate remains slightly above the 6% boom-bust threshold (refer to the monthly chart below), it’s possible that the US economy has entered the bust phase of the cycle.

Actually, it’s LIKELY that the US economy has entered the bust phase. This is because even though the monetary inflation rate has not yet dropped below our boom-bust threshold, it has dropped far enough to bring about a significant widening of credit spreads and cause the 10Y-2Y yield-spread to become inverted briefly in early-April.

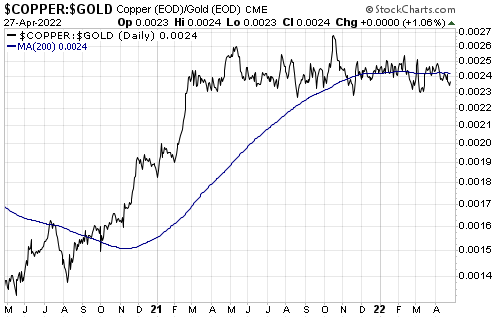
The most important boom-bust timing indicator that is yet to signal an end to the boom is the gold price relative to the prices of industrial metals such as copper. As illustrated by the following chart, since peaking last October the copper/gold ratio has chopped around at a high level. It must make a sustained break below its March-2022 low to signal the sort of relative strength in gold that would be consistent with the bust phase of the cycle.

*The Fed published the money-supply data for March-2022 on Tuesday 26th April.

Print This Post Print This Post