Print This Post Print This Post

US monetary deflation intensifies

April 29, 2023

[This blog post is an excerpt from a recent commentary published at speculative-investor.com]

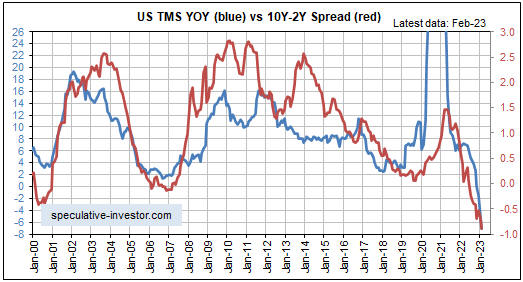
The US money-supply data for March-2023, which were published on Tuesday of this week, reveal that the monetary inflation rate has continued its ‘swan dive’. As illustrated below, the year-over-year growth rate of US True Money Supply (TMS) is now around negative 10%, that is, at the end of March-2023 the US money supply was about 10% smaller than it was a year earlier. The last time there was a double-digit annual percentage contraction in the US money supply was the early-1930s.

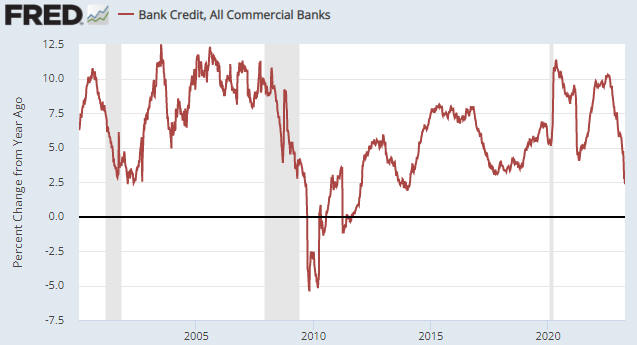
The Fed has signalled that it will maintain downward pressure on the money supply via its QT program, so a further decline in the monetary inflation rate is likely unless commercial banks lend enough new money into existence to counteract the Fed. So, what are the chances of the commercial banks generating enough new credit in the short-term to counteract the Fed?

Given the stresses that recently have emerged in the banking system combined with the trend towards tighter commercial bank lending standards that was well underway before last month’s banking panic and the plunge in the rate of bank credit growth illustrated by the following chart, the chances are slim to none. That is, a further monetary contraction appears to be in store.

Just to recap, in 2020 the Fed flooded the US economy and financial markets with dollars in an effort to make it seem as if the government could impose major restrictions on economic activity for several months without causing widespread hardship. Then, throughout 2021 the Fed acted as if the monetary deluge of 2020 would have only minor inflationary effects, mainly because major effects were yet to appear in backward-looking statistics such as the CPI. During the first half of 2022 the Fed finally realised that its prior actions had caused a major inflation problem, and in response it embarked on an aggressive monetary tightening program. However, by the time the Fed started tightening, the monetary inflation rate already had collapsed from a high of almost 40% to around 7% and the rate of CPI growth was within three months of its cycle peak.

Now we have the Fed still in tightening mode even though a) the US economy has just experienced the largest money-supply shrinkage since the Great Depression and b) the CPI growth rate is about 10 months into a cyclical decline. Why? Mainly because the backward-looking CPI hasn’t yet fallen far enough to reach the Fed’s arbitrary target.

At some point during the second half of this year the Fed will realise that its monetary tightening has gone too far, and at around the same time it will start coming under political pressure to create the illusion of prosperity in the lead-up to the November-2024 Presidential Election. It then undoubtedly will begin to lean in the opposite direction, again with its eyes firmly fixed on the rear-view mirror (backward-looking data). This will set the scene for the next great inflation wave.

The Federal Reserve is like a loose cannon on the deck of a ship in a storm. It is crashing into things and generally wreaking havoc, although unlike an actual loose cannon it pretends to be the opposite of what it is. It pretends to be a force for financial and economic stability.

The problem is the institution itself rather than the current leadership. The current leadership is inept and dangerous due a lack of understanding of what’s happening in the world, a lack of understanding of how its own actions affect long-term progress, and a strong belief that it knows what’s best. However, giving an individual or a committee the power to manipulate the money supply and interest rates would be problematic even if those doing the manipulating were competent.

Print This Post Print This Post

Gold and Real Interest Rates

April 17, 2023

[This blog post is an excerpt from a commentary published at TSI on 9th April]

The following chart shows that the yield on the 10-year Treasury Inflation-Protected Security (TIPS), a proxy for the real long-term US interest rate, has oscillated within a horizontal range over the past seven months. These interest rate swings may not appear to be significant, but they have had significant effects on the financial markets in general and the gold market in particular.

With regard to the effects on the gold market of the recent swings in the 10-year TIPS yield, we note that:

1. The multi-year high recorded by the 10-year TIPS yield on 3rd November of last year coincided with the end of a multi-year downward correction in the US$ gold price.

2. The short-term low in the 10-year TIPS yield on 1st February of this year coincided with a short-term peak in the US$ gold price.

3. The short-term high in the 10-year TIPS yield on 8th March coincided with the end of a short-term correction in the US$ gold price.

4. The US$ gold price rocketed upward from 8th March through to the end of last week as the 10-year TIPS yield moved back to the bottom of its range.

With the 10-year TIPS yield now at the bottom of its 7-month range, the most likely direction of the next multi-week move is upward. However, at some point there will be a sustained breakout from this range, with major consequences for the financial markets.

If the eventual breakout in the 10-year TIPS yield is to the upside, it will be bearish for everything except the US dollar. This is a low-probability scenario because it would require the Fed to either continue its monetary tightening in the face of severe economic weakness or take no action when presented with obvious evidence of deflation.

If the eventual breakout in the 10-year TIPS yield is to the downside, the consequences for asset and commodity prices will depend on whether the primary driver of the breakout is a falling nominal yield or rising inflation expectations (the real interest rate is the nominal interest rate minus the EXPECTED inflation rate). A downside breakout in the real interest rate that was driven by a falling nominal yield would be bullish for gold and probably also would be bullish for the US$ relative to other major currencies, while being bearish for most commodities and equities. This is because it likely would result from severe economic weakness. A downside breakout in the real interest rate that was driven by rising inflation expectations would be bullish for gold, but more bullish for cyclical commodities (e.g. the industrial metals) and equities. It would be bearish for the US$.

We expect that at some point within the next four months the 10-year TIPS yield will make a sustained break below the bottom of its range, primarily due to falling nominal interest rates. It could happen as soon as this month, but July-August is a more likely timeframe. It mainly depends on how quickly the economy deteriorates.

Print This Post Print This Post

Is a yield curve reversal in progress?

April 4, 2023

[This blog post is an excerpt from a TSI commentary published last week]

The US 10yr-2yr yield spread, a proxy for the US yield curve, has rebounded sharply over the past couple of weeks (refer to the following daily chart), from more than 100 basis points below zero to ‘only’ about 50 basis points below zero. Is this the start of a steepening trend for the US yield curve?

There is one good reason to believe that the recent upturn shown on the above chart did NOT mark the start of a new trend. The reason is the relationship between the monetary inflation rate (the blue line) and the 10yr-2yr yield spread (the red line) illustrated on the chart displayed below. This chart shows that the yield spread tends to follow the monetary inflation rate and that the monetary inflation rate was still in a downward trend at the end of February-2023.

Further to the above chart, a yield curve inversion is caused by a large decline in the monetary inflation rate and a major shift in the yield curve to a new steepening trend is caused by a major upward reversal in the monetary inflation rate. Currently there is no sign of an upward reversal in the monetary inflation rate.

As an aside, the 10yr-2yr spread is just one indicator of the yield curve. The 10yr-3mth spread (see chart below) is equally important and made a new inversion extreme on Monday of this week. In other words, there is no evidence of a shift towards steepening in the 10yr-3mth spread.

Perhaps it will be different this time and a yield curve shift to a steepening trend will precede a money-supply growth rate reversal, but we wouldn’t bet on it. As long as monetary conditions as indicated by the monetary inflation rate are still tightening, there will be upward pressure on short-term interest rates relative to long-term interest rates. This is because short-term interest rates will be kept relatively high by the increasingly urgent desire for short-term financing, while long-term zero-risk interest rates will reflect the expected eventual effects on prices and economic activity of today’s tight monetary conditions.

Print This Post Print This Post