[This blog post is a modified excerpt, including updated charts, from a TSI commentary published about three weeks ago]
The oil futures market remains in strong backwardation. The fact that the oil futures curve still has a steep downward slope (meaning: nearer contracts are priced well above later contracts) indicates that the physical supply situation is still ‘tight’. Moreover, oil supply probably will remain somewhat tight for at least the next two months due to the natural gas shortage in Europe and the resultant need to find a substitute fuel for electricity generation. This suggests that the oil price bottomed on a multi-month basis when it dropped to the low-US$60s in early-December. At the same time, macroeconomic considerations and intermarket relationships suggest that the October-2021 high near US$85 was the intermediate-term variety (a high that holds for at least 6 months).
With regard to the macroeconomic backdrop, as recently as two months ago inflation expectations were trending higher and the yield curve had not confirmed a shift from steepening to flattening. However, we now have evidence that inflation expectations peaked in November-2021 and confirmation of a trend reversal in the yield curve. Both of these changes remove macroeconomic supports for commodities, including oil.
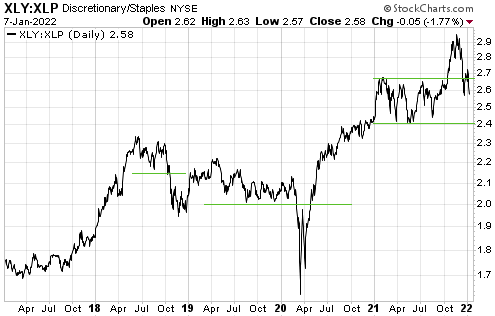
Also, signs of declining growth expectations have begun to appear. It’s early days, but we view the recent performance of the XLY/XLP ratio as a ‘shot across the bow’.
By way of explanation, here’s what we wrote about the XLY/XLP ratio on 27th October:
“The performance of the Consumer Discretionary ETF (XLY) relative to the performance of the Consumer Staples ETF (XLP) is a good indicator of whether stock market participants, as a group, are favouring growth or safety. Specifically, when the XLY/XLP ratio is trending upward it indicates that the market is tilting towards growth and when the XLY/XLP ratio is trending downward it indicates that the market is tilting towards safety. Consequently, when this ratio signals a trend reversal by breaking above a prior high or below a prior low, it is useful information.”
Until late-November the XLY/XLP ratio was in a clear upward trend, indicating that the financial world was tilting towards growth. It hasn’t yet confirmed a downward trend reversal, but it has fallen far enough to negate the October upside breakout.
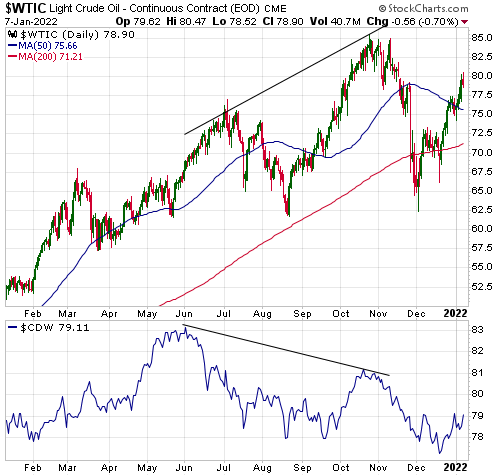
With regard to intermarket relationships, the divergence between the oil price and the Canadian dollar (C$) sticks out. The following chart shows that the divergence was made substantially smaller by the late-November Omicron mini panic that caused the oil price to plunge from the mid-$70s to the low-$60s, but it hasn’t been eliminated. We note, in particular, that during December the oil price reversed upward from above its August low whereas the C$ made a new low for the year.
The combination of the various influences suggests that the oil price will spend the next two months trading between the mid-$60s and the low-$80s. What happens after that will be determined by macroeconomic and supply developments that aren’t yet knowable.
 Print This Post


