[This post is a slightly-modified excerpt from a TSI commentary published about two weeks ago.]
The way that most new money was created over the past 10 years was different to how it was created during earlier cycles. During earlier cycles almost all new money was loaned into existence by commercial banks, but in the final few months of 2008 the Fed stopped relying on the commercial banks and began its own money-creation program (QE).
The difference is important because most of the money created by commercial banks is injected into the ‘real economy’ (the first receivers of the new money are businesses and the general public), whereas all of the money created by the Fed is injected into the financial markets (the first receivers of the new money are bond traders). The Fed’s new money eventually will find its way to Main Street (as opposed to Wall Street), but the rate of monetary inflation experienced by the ‘real economy’ during the years following the Global Financial Crisis was a lot lower than suggested by the change in the US True Money Supply (TMS). Consequently, there may have been a lot less mal-investment during the current cycle than during the years leading up to the 2007-2009 crisis.
Don’t get us wrong — there has been a huge amount of ill-conceived and misdirected investment due to the Fed’s money-pumping and associated suppression of interest rates. Due to these bad investments, corporate balance sheets are now much weaker, on average, than otherwise would be the case. In particular, the corporate world collectively has gone heavily into debt and in a lot of cases the debt has not been used productively. For example, it has been used to buy back shares or fund high-priced acquisitions. This will have very negative consequences for the stock market within the next few years, but wasting money on share buy-backs and over-paying for assets does not cause the business cycle.
The ‘boom’ phase of the business cycle happens when artificially-low interest rates prompt investment, on an economy-wide scale, in new production facilities and construction projects that would not have seemed viable in the absence of the distorted interest-rate signal. The ‘bust’ phase of the business cycle kicks off when it starts to become apparent that, due to rising construction/production costs and/or less consumer demand than forecast, the aforementioned investments either cannot be completed or will generate a lot less cash than originally expected. Widespread liquidation ensues, and — as long as policy-makers don’t do too much to ‘help’ — resources eventually get reallocated in a way that meshes with sustainable consumer demand. The economy recovers.
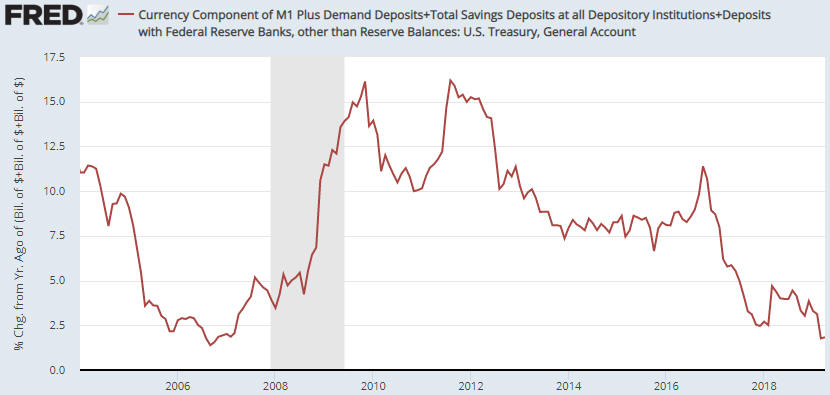
The above is background information for the following charts. The first chart shows the year-over-year (YOY) rate of change in US True Money Supply (TMS), a.k.a. the US monetary inflation rate. The second chart shows the US monetary inflation rate without the Fed’s direct additions and deletions*.
Note that the second chart does not show what would have happened to the US monetary inflation rate in the absence of the Fed. Regardless of whether the Fed is creating new money or not, it exerts a strong influence on the commercial banks. What we have tried to do with the second chart is isolate the monetary inflation that causes the business cycle.
Prior to late-2008 the charts are very similar, but from late-2008 onwards there are some big divergences. The most obvious divergence was in 2009, when the rate of growth in TMS extended the rapid upward trend that began in 2008 while the rate of growth in “TMS minus Fed” collapsed to well below zero. Also worth mentioning is that the rate of growth in “TMS minus Fed” was in negative territory from August-2013 to June-2014, a period during which the rate of growth in TMS never dropped below 7%.
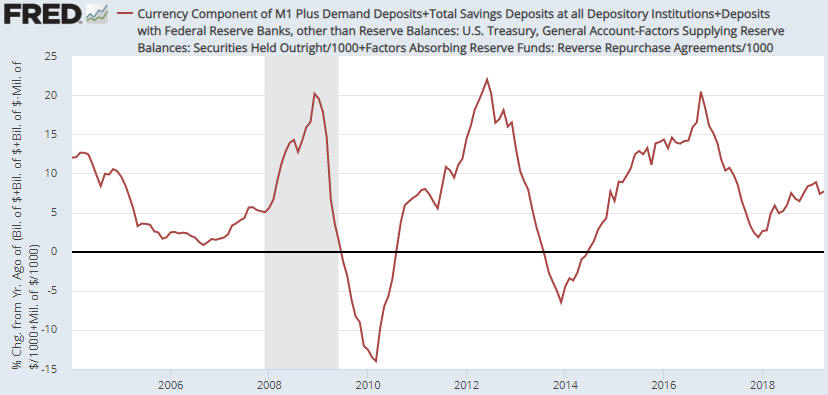
The swings in the “TMS minus Fed” growth rate explain some of the important swings in the US economy. For example, the rapid increase in “TMS minus Fed” during 2011-2012 almost certainly is linked to the mad rush to invest in the shale oil industry, and the 2013-2014 plunge in “TMS minus Fed” would be partly responsible for the collapse of the shale-oil investment boom during 2014-2015. Although it was focused on a single industry, this was a classic case of the mal-investment that results in a boom-bust cycle.
Over the past 18 months the TMS growth rate has extended its major downward trend, but the “TMS minus Fed” growth rate has rebounded. This rebound could delay the start of a recession.
*We assume that the amount of money added by the Fed equals the increase in the Fed’s holdings of securities minus the increase in Reverse Purchase Agreements.