Print This Post Print This Post

Oil and Regime Uncertainty

September 26, 2022

[This blog post is an excerpt from a recent TSI commentary]

Last year US President Biden was telling oil companies that they should be producing less. Then, during the first few months of this year he berated oil companies for not rapidly increasing their production in response to higher prices. Who knows what he will be telling oil companies to do next year or even next week? In this political environment, why would high-profile, publicly-listed oil companies make large investments in long-term oil production growth?

The answer is that they wouldn’t. Even if the next US president understands the need to increase fossil fuel production for at least another 10-15 years and is prepared to stand up to the crowd of misguided environmentalists who seem to believe that renewable energy systems can be created out of nothing, the person that gets the job four years later could have no such understanding and/or no backbone. Therefore, even if the political landscape were to become temporarily supportive, it would be too risky to invest in anything other than small projects with rapid paybacks.

Consequently, we probably have reached “Peak Oil”. This is not the Peak Oil that became a popular story during 2004-2008, because there is no doubt that oil production could be increased with the appropriate investment. It is Peak Oil caused by Regime Uncertainty. As defined HERE, Regime Uncertainty is a pervasive lack of confidence among investors in their ability to foresee the extent to which future government actions will alter their private-property rights.

Due to Regime Uncertainty, we expect that two things will happen over the next few years. The first is that the oil price will make a sustained move above this year’s high (US$130/barrel), because demand will grow (following the 2022-2023 recession) and the oil industry will not respond with large-scale investments in new production. The second is that there will be substantial growth in the amount of wealth returned by oil producers to their shareholders via dividends and share buybacks.

As is the case with NG [natural gas] stocks, short-term weakness in the commodity market combined with downward pressure exerted by the general equity bear market could create excellent opportunities to increase exposure to the oil sector within the next few months.

Print This Post Print This Post

The Inflation Shock

September 20, 2022

[This blog post is an excerpt from a TSI commentary published last week]

The financial markets were shocked — shocked, we tell ya! — by the US CPI for August. We know they were shocked because on the day of the CPI release the US stock market gave back almost all of the gain achieved during the preceding strong 4-day rebound and there was a big up-move in the Dollar Index. Before we take a look at the CPI report that caused the mini panic, it’s worth repeating the following comments from the 15th August Weekly Update:

Over the past few weeks the financial markets have celebrated the signs of declining “inflation”, the thinking being that the evidence of an inflation reversal will lead to a Fed pivot in the short-term. This line of thinking is wrong in two critical ways.

The first way it is wrong is that the Fed’s leadership appears to have its eyes firmly fixed on the rear-view mirror. Although there is now a CPI downtick in the rear-view mirror, base effects (the CPI increases that will remain in the year-over-year calculations for months to come) ensure that the headline CPI growth numbers will remain elevated for at least the remainder of this year. For example, even though inflation most likely has peaked on an intermediate-term basis, the numbers that will stay in and drop out of the year-over-year calculations each month mean that there is almost no chance of the year-over-year CPI growth rate dropping below 6% sooner than the first quarter of next year. In fact, the year-over-year CPI growth rate reported for each of the next three months probably will still have an ‘8 handle’.

Therefore, for months to come the Fed is going to be seeing annual CPI growth rates near multi-decade highs, which will encourage it to continue tightening.

The second way it is wrong is that even after the Fed’s leadership starts to feel confident that inflation is heading towards a level that it deems acceptable, there won’t be an immediate policy reversal.

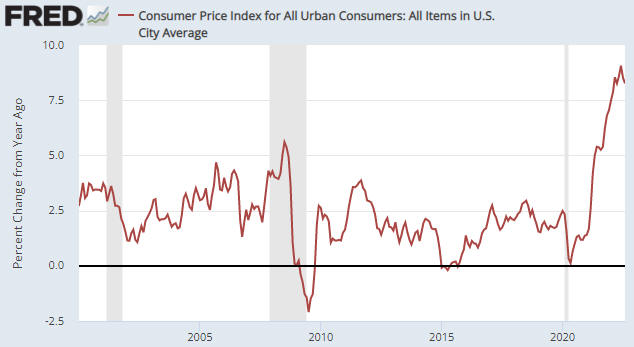
The evidence continues to accumulate that inflation is now in a downward trend, but due to the price increases that have already occurred it is reasonable to expect that the year-over-year CPI growth numbers will be near multi-decade highs for at least a few more months. Nobody should expect anything else. Certainly, nobody should have been shocked by the 8.3% year-over-year CPI growth number reported for August.

The 8.3% growth rate reported for August followed 8.5% in July and 9.1% in June. This is probably the start of a downward trend that won’t bottom until Q2-Q3 of next year. More significantly, we point out that the percentage change in the CPI over the past two months was approximately zero — the result of a large decline in the gasoline price offset by price gains elsewhere (e.g. in rent and food).

However, the monthly chart displayed below shows that the numbers remain very high relative to everything over the past twenty years prior to the past few months. This is the issue, given the tendency of the Fed’s leadership to fixate on the rear-view mirror.

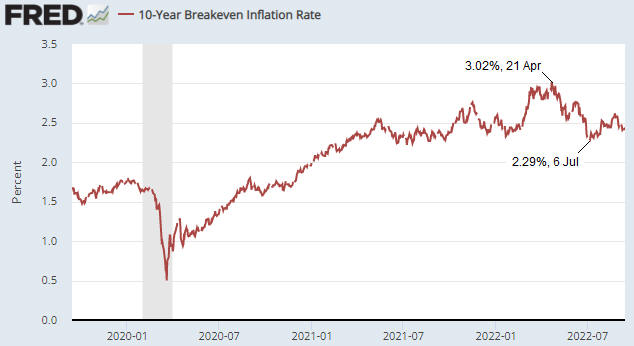
It’s worth mentioning that there continues to be a wide gap between the current CPI growth rate and the expected future CPI growth rate.

The following daily chart shows that the 10-Year Breakeven Rate, a measure of what the bond market expects the CPI to be in years to come, peaked on 21st April this year at 3.02%, made a short-term bottom at 2.29% on 6th July and currently is much closer to a 12-month low than a 12-month high. There’s a good chance that the expected CPI will drop to 2.0% or lower during the stock market’s next large multi-month decline.

The problem for the stock market bulls who take every hint of declining “inflation” as a reason to anticipate a shift from monetary tightening to monetary easing is that such a shift won’t happen within the next six months unless there is a lot more economic and stock market weakness. We think that the aforementioned monetary shift will happen during the first quarter of next year, but that’s only because we are expecting a lot more weakness in the stock market and the economy.

Print This Post Print This Post
Monetary inflation around the world

September 6, 2022

[This blog post is an excerpt from a recent TSI commentary]

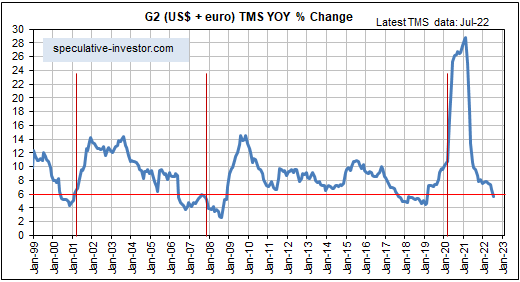
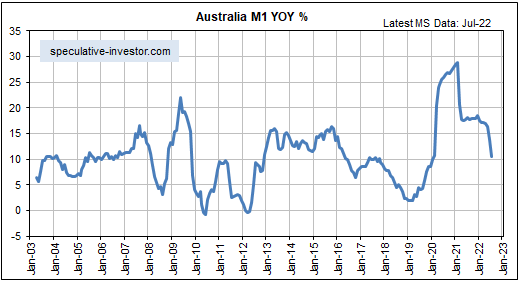
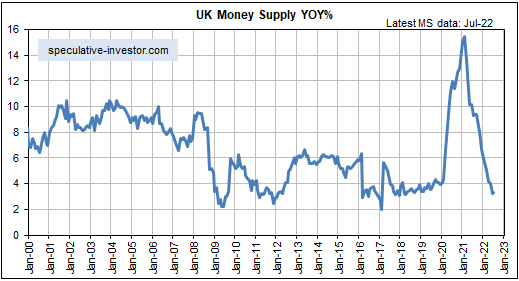
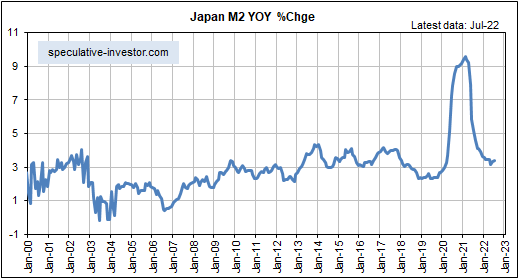
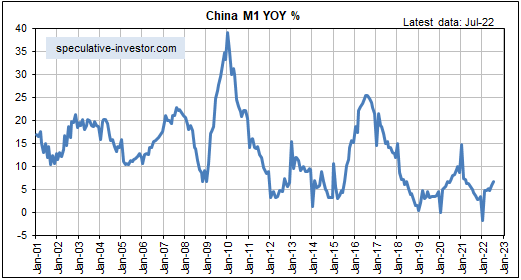
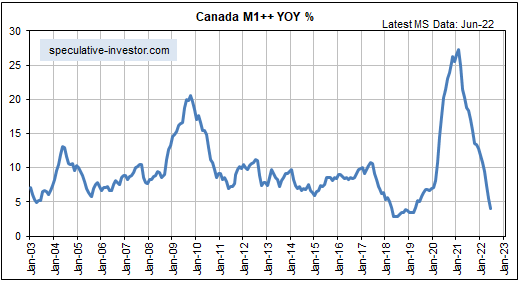
In most countries/regions around the world, monetary inflation rates peaked at extraordinary heights in early 2021 and have since crashed. Furthermore, the declines are set to continue over the next several months as central bankers attempt to make up for their mistake of being far too ‘easy’ during 2020-2021 by being far too ‘tight’ during 2022-2023, thus revealing a fondness for irony given that part of the official justification for central banks is to smooth-out the business cycle. Here are monthly money-supply charts showing where we are and where we’ve been.

G2 True Money Supply (TMS), a concoction of ours that combines the money supplies of the US and the euro-zone, is the primary driver of the global boom-bust cycle. The following chart shows that in July-2022 the year-over-year G2 TMS growth rate dropped below the boom-bust threshold. With both the Fed and the ECB intent on contracting their balance sheets over the months ahead, it’s a virtual certainty that the line on this chart will continue to move downward. This will worsen the global recession that is already underway.

At a little over 10%, Australia’s monetary inflation rate remains high. However, it has come down a lot from its level of 18 months ago and looks set to drop to 5% or lower over the next several months as the Reserve Bank of Australia ‘tightens the screws’. This is bearish for Australia’s real estate market, where valuations generally remain extremely high.

Over the past 18 months Canada’s monetary inflation rate has collapsed from an all-time high to near a multi-decade low. This has very bearish implications for Canada’s real estate market.

The UK’s monetary inflation rate also has collapsed from an all-time high to near a multi-decade low.

Japan has been a monetary inflation enigma for a long time, in that despite the appearance of aggressive Bank of Japan (BOJ) money pumping the year-over-year growth rate of Japan’s M2 money supply spent the bulk of the past 25 years in the 0%-4% range. In response to the COVID crisis the M2 growth rate surged to almost 10% in 2020-2021, but it has since fallen back to its low/narrow multi-decade range.

With regard to money-supply growth, China has been the ‘odd man out’ over the past three years. In China the monetary response to the COVID crisis was relatively minor and by January of this year the year-over-year growth rate of M1 money supply had dropped below zero. It has since rebounded to around 7%.

The following chart shows that China’s monetary inflation rate has been making lower highs and lower lows (trending downward, that is) since 2010. It probably isn’t a fluke that this downward trend coincides with Xi Jinping’s leadership, because Xi does not like financial speculation.

China’s relatively slow rate of monetary inflation over the past few years is a long-term plus for that country’s economy, but it is being counteracted by many negatives including the severe damage that has been wrought by the “Dynamic Zero COVID” policy.

Once central banks have created a bubble the best they can do is step aside and let the markets sort out the mess. Stepping aside would involve not creating any more money and not destroying any existing money. The worst they can do is take money out of the economy, because that causes additional price distortions and because simply ending the pumping-in of new money would be sufficient on its own to burst the bubble. Currently, central banks are doing the worst they can do in an effort to address price rises resulting from supply constraints, as if reducing the availability of money and credit will promote the investment needed to bring about additional supply. These actions will have dire consequences.

Print This Post Print This Post