Print This Post Print This Post

Banks versus Gold

September 30, 2019

One of the past month’s interesting stock-market developments was the strength of the banking sector in both nominal terms and relative to the broad market. The strength in nominal dollar terms is illustrated by the top section of the following weekly chart, which shows that the US Bank Index (BKX) is threatening to break out to the upside. The strength relative to the broad market is illustrated by the bottom section of the chart, which reveals a sharp rebound in the BKX/SPX ratio since the beginning of September.

BKX_SPX_300919

Bank stocks tend to perform relatively well when long-term interest rates are rising in both absolute terms and relative to short-term interest rates. This explains why the banking sector outperformed during September and also why bank stocks generally have been major laggards since early last year.

Valuations in the banking sector are depressed at the moment, as evidenced by relatively low P/Es and the fact that the BKX/SPX ratio is not far from a 25-year low. This opens up the possibility that we will get a few quarters of persistent outperformance by bank stocks after long-term interest rates make a sustained turn to the upside.

On a related matter, the relative performance of the banking sector (as indicated by the BKX/SPX ratio) is an input to my “true fundamentals” models for both the US stock market and the gold market. However, when the input is bullish for one of these markets it is bearish for the other. In particular, relative weakness in the banking sector is considered to be bullish for gold and bearish for general equities.

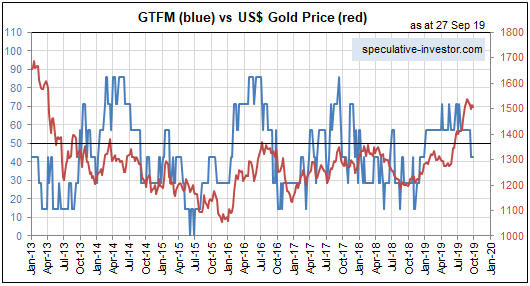
Until recently the BKX/SPX input was bullish in my gold model and bearish in my equity model, but there was enough relative strength in the banking sector during the first half of September to flip the BKX/SPX input from gold-bullish to equity-bullish. As a consequence, during the second week of September there was a shift from bullish to bearish in my Gold True Fundamentals Model (GTFM). This shift is illustrated on the following weekly chart by the blue line’s recent dip below 50.

The upshot is that the fundamental backdrop, which was supportive for gold from the beginning of this year through to early-September, is now slightly gold-bearish. My guess is that it will return to gold-bullish territory within the next two months, but in situations like this it is better to base decisions on real-time information than on what might happen in the future.

GTFM_300919

Print This Post Print This Post

Gold and the ‘Real’ Interest Rate

September 10, 2019

[This blog post is an excerpt from a commentary published at TSI on 1st September 2019.]

It’s well known that the US$ gold price often trends in the opposite direction to the US real interest rate. This relationship is illustrated by the following chart in which the real interest rate is represented by the yield on the 10-year TIPS (Treasury Inflation Protected Security).

Notice that the 10-year TIPS yield has just gone negative and that the previous two times that this proxy for the real interest rate went negative the gold price was at an important peak. Specifically, the real interest rate going negative in August-2011 coincided with a long-term top in the gold price and the real interest rate going negative in July-2016 coincided with an intermediate-term top in the gold price. If gold tends to benefit from a lower real interest rate, why would the gold price reverse downward shortly after the real interest rate turned negative?

Considering only the 2016 case the answer to the above question seems obvious, because in July-2016 the TIPS yield reversed course and began trending upward soon after it dipped into negative territory. In other words, the downward reversal in the gold price coincided with an upward reversal in the real interest rate. However, in 2011-2012 the real interest rate continued to trend downward for more than a year after the gold price peaked.

We think there are two reasons why the gold price didn’t make additional gains in 2011-2012 after the real interest rate turned negative. First and foremost, the real interest rate is just one of several fundamental gold-price drivers (the 10-year TIPS yield is one of seven inputs to our Gold True Fundamentals Model), and after August-2011 the upward pressure exerted by a falling real interest rate was counteracted by the downward pressure exerted by other fundamental influences. Second, in August-2011 a further significant decline in the real interest rate had been factored into the current gold price.

The risk at the moment is that on a short-term basis the bullish fundamental backdrop, including the potential for a further decline in the ‘real interest rate’, is fully discounted by the current price. This risk is highlighted by the fact that the total speculative net-long position in Comex gold futures is very close to an all-time high. It is also highlighted by the fact that the RSI displayed in the bottom section of the following weekly chart is almost as high as it ever gets.

Print This Post Print This Post