[This blog post is an excerpt from a commentary posted at TSI last week]
The rebound from the H1-2020 plunge into recession probably will look like a ‘V’, at least initially. This is not because conditions will become positive as quickly as they became negative, but because conditions got so bad so quickly that charts of economic statistics such as industrial production and retail sales will appear to make a ‘V’ bottom in Q2-Q3 of this year. However, the ‘V’ won’t mark the start of a genuine recovery.
The following charts show what we mean by “got so bad so quickly”.
The first chart shows that within the space of three months the Small Business Optimism Index collapsed from a level that indicated a high level of optimism to one of the lowest levels in the 34-year history of the index. The only other decline of this magnitude occurred during the 2005-2008 period and took more than two years.
The second chart shows that Industrial Production has just registered its largest month-over-month decline in at least 101 years. By this measure, even the worst months of the Great Depression were not as bad as April-2020.
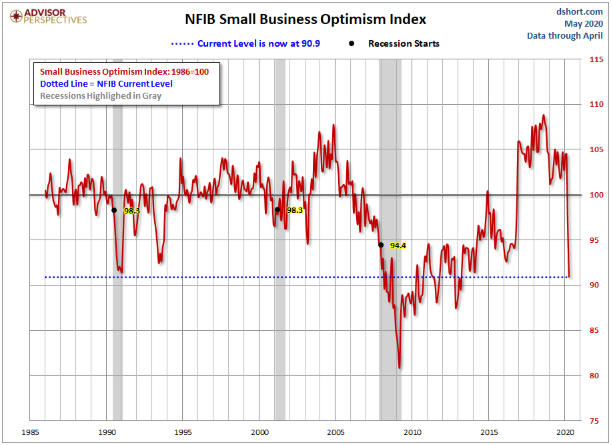
Source: dshort
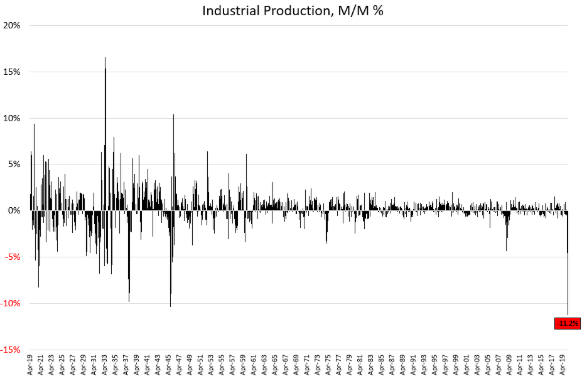
Source: Hedgeye
There are thousands of people who have lost their businesses — in some cases, businesses that they spent the bulk of their adult lives building — over the past two months as a result of the lockdowns. These people probably are feeling angry and/or devastated. However, we get the impression that the vast majority of people have accepted the lockdowns with equanimity. They haven’t taken to the streets to protest the economic destruction that has been wrought by their political overlords. Instead, they have shrugged off the most rapid decline in industrial production in history and a sudden rise in the unemployment rate from below 4% to above 20%. How is this possible?
It’s possible only because the government and the Fed have showered the people with money. The money that has been created out of nothing is acting like pain-suppressing medication. In effect, the government and the Fed have administered anaesthetic so that the patient felt no pain as vital organs were removed. Without this anaesthetic, the populace would not have remained docile as its basic rights were cancelled and its economic prospects were greatly diminished.
Money, however, is just the medium of exchange. It facilitates the division of labour*, but it does not constitute real wealth. For example, if every current dollar were instantly replaced by ten dollars, there wouldn’t be any additional wealth. The point is that the government and the Fed cannot make up for the decline in real wealth caused by the lockdowns by providing more money. All they can do is change the prices of the wealth that remains.
There will be a ‘V’ shaped recovery, but due to the destruction of real wealth stemming from the lockdowns the rising part of the V is bound to be much shorter than the declining part of the V. This will lead to a general realisation that life for the majority of people will be far more difficult in the future than it was over the preceding few years.
Returning to our medical analogy, eventually the anaesthetic will wear off and the patient will have to start dealing with the consequences of having lost a kidney, a spleen, a lung and half a liver.
*In the absence of money, a tomato farmer who needed some dental work would have to locate a dentist who needed a few crates of tomatoes.