Print This Post Print This Post

Wrongheaded thinking about China’s devaluation

August 31, 2015

After China’s government announced a small reduction in the Yuan’s foreign exchange (FX) value early last month, US Presidential aspirant Donald Trump immediately leapt onto the nearest available podium and exclaimed:

They [the Chinese] continuously cut their currency. They devalue their currency. And I have been saying this for years. They have been doing this for years. This isn’t just starting. This was the largest devaluation they have had in two decades. They make it impossible for our businesses, our companies to compete. They think we’re run by a bunch of idiots. And what’s going on with China is unbelievable, the largest devaluation in two decades. It’s honestly…a disgrace.

The fact is that even after its recent “devaluation”, relative to the US$ the Yuan is up by 8% over the past 5 years and 30% over the past 10 years. Here’s a chart showing the performance (a rising line on this chart indicates a strengthening of the Yuan relative to the US$). Take a look at this chart and then re-read the above Trump comments.

Yuan_310815

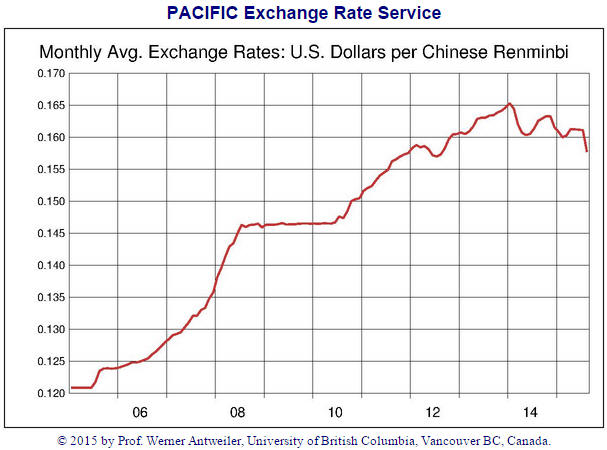
Is Trump really that poorly informed about what’s going on? Perhaps, but probably not. It’s clear that Trump has become the consummate populist — someone who is willing to say anything that he thinks will strike a chord with a large mass of voters, even if he knows that what he is saying is complete nonsense.

In the case of China’s so-called devaluation, however, it isn’t just bombastic billionaires with a lust for political power who have misrepresented the situation. Anyone who has claimed that the Yuan’s devaluation was primarily about boosting exports has a poor understanding.

The reality is that the Yuan is very over-valued and has begun to fall under the weight of this over-valuation. Furthermore, rather than deliberately devaluing the Yuan, as part of its effort to maintain the semblance of stability China’s government has actually been trying to prevent the Yuan from devaluing. This can be deduced from the fact that China’s government has been selling-down its FX reserves (selling reserve-currency (mostly US$) assets and buying the Yuan puts upward pressure on the Yuan’s relative value). However, trying to prop-up the exchange rate via the selling of FX reserves and the simultaneous buying of the local currency is a form of monetary tightening, which, according to the fatally-flawed Keynesian theories that guide policymakers the world over, is the last thing that China’s economy needs right now.

Faced with the choice of keeping the Yuan’s FX value at an unrealistically high level via a form of monetary tightening or allowing the currency to start falling under the weight of its own over-valuation, China’s policymakers opted for the latter. Actually, they didn’t have much of a choice.

Print This Post Print This Post

Gold manipulators should be fired for poor performance

August 25, 2015

Despite the huge differences between gold and all other commodities, gold is still a commodity and its US$ price is still affected by the overall trend in commodity prices. In particular, a major decline in commodity prices will naturally put downward pressure on the gold price and a major advance in commodity prices will naturally put upward pressure on the gold price. That’s why gold’s performance can be most clearly ‘seen’ by comparing it to the performances of other commodities. When this comparison is done it becomes apparent that gold is now very expensive or at least very highly-priced relative to historical levels.

As evidence I present the following chart of the gold/CRB ratio. This chart shows that relative to the basket of commodities represented by the CRB Index, gold has just made a new multi-decade high.

gold_CRB_240815

When I look at the above chart I can’t help but think it’s just as well that gold is being manipulated lower, because just imagine how expensive it would otherwise be.

It won’t surprise me if gold moves even higher relative to commodities in general over the coming month in parallel with an on-going flight from risk. Also, I expect the long-term upward trend in the gold/CRB ratio to continue. Lastly, it’s clear that the operators of the great gold-market price-suppression scheme have been doing a lousy job and deserve to be fired for poor performance.

Print This Post Print This Post

China’s bubble has burst

August 24, 2015

When I say that China’s bubble has burst I’m not referring to the recent large decline in the stock market. Although the stock market was the focal point of Chinese speculation during 2006-2007 and during an 8-month period beginning last October, in the grand scheme of things it is no more than a sideshow. Unfortunately, the stock market crash is a minor issue compared to the main problem.

The main problem is that China’s economy is the scene of a credit bubble of historic proportions. That this is indeed the case is evidenced by the following charts from an article posted by Steve Keen last week.

The first chart shows the ratio of private debt to GDP over the past 30 years for the US (the blue line), Japan (the red line) and China (the black line). In particular, the chart shows that China’s current private-debt/GDP is well above the 30-year high for US private-debt/GDP, which suggests that China’s private-debt bubble is bigger than the US bubble that burst in 2007-2008.

chinadebt_gdp_240815

The above chart indicates that China’s private-debt bubble isn’t yet as big as the bubble that popped in Japan in the early-1990s, but the next chart shows that the rate of private-debt growth in China over the past several years is far in excess of anything that happened in either Japan or the US in the years leading up to their respective bubble peaks.

chinadebtroc_240815

There’s no telling how big a credit bubble will become before it bursts, so the fact that China’s economy is host to one of history’s greatest-ever credit bubbles doesn’t mean that the bubble won’t continue to inflate for years to come. However, there are clues that China has transitioned to the long-term bust phase of the monetary-inflation-fueled boom-bust cycle, that is, there are clues that China’s bubble has burst.

Chief among these clues is the large and accelerating flow of money out of China. So-called “capital outflows” from China have been increasing over the past 12 months and according to a recent Telegraph article amounted to $190B over just the past 7 weeks.

Pressure caused by the flow of “capital” out of China led to the small Yuan devaluation that garnered huge media coverage a couple of weeks ago. In an effort to maintain the semblance of stability, if China’s government had been able to delay the inevitable and keep the Yuan propped-up at an artificially-high level for longer, it would have done so. In other words, the devaluation was a tacit admission by China’s government that the pressure caused by capital outflows had become too great to resist.

Once a private-sector credit bubble begins to unwind, the process is irreversible. The standard Keynesian remedy is to replace private debt with public debt, but all this does is add new distortions to the existing distortions.

Print This Post Print This Post

The meaning of the 6-year low in GLD’s bullion inventory

August 21, 2015

At the end of the week before last the amount of physical gold held by the SPDR Gold Trust (GLD), the largest gold bullion ETF, fell to its lowest level since September-2008. What does this tell us?

In many TSI commentaries over the years and in a couple of posts at the TSI blog over the past year I’ve explained that changes in GLD’s bullion inventory are not directly related to the gold price. Neither a large rise nor a large fall in the gold price would necessarily require a change in GLD’s inventory, the reason being that as a fund that holds nothing other than gold bullion the net asset value (NAV) of a GLD share will naturally move by the same percentage amount as the gold price.

However, there is an indirect relationship between the gold price and GLD’s bullion inventory. At least, there has been such a relationship in the past. I am referring to the long-term correlation between the gold price and the GLD inventory that stems from changes in sentiment.

As traders in GLD shares become more optimistic about gold’s prospects they sometimes buy aggressively enough to push the market price of GLD above its NAV, which prompts an arbitrage trade by Authorised Participants (APs) involving the issuing of new GLD shares and the addition of physical gold to GLD’s inventory. And as traders in GLD shares become more pessimistic about gold’s prospects they sometimes sell aggressively enough to push the market price of GLD below its net asset value (NAV), prompting an arbitrage trade by APs involving the redemption of GLD shares and the removal of physical gold from GLD’s inventory.

That is, changes in GLD’s market price relative to its NAV create opportunities for arbitrage trades that adjust the supply of GLD shares and the amount of physical bullion held by the fund, thus ensuring that the market price never deviates far from the NAV. This modus operandi is common to all ETFs.

Since traders in GLD shares tend to become more optimistic in reaction to a rising price and less optimistic in reaction to a falling price, the most aggressive buying of GLD shares will tend to occur after the gold price has been trending higher for a while and the most aggressive selling of GLD shares will tend to occur after the gold price has been trending lower for a while. This explains why the following chart shows that the long-term correlation between the gold price and the GLD inventory is strongly positive and why the major downward trend in GLD’s inventory began well after the 2011 peak in the gold price.

The upshot is that the price trend is the cause and the GLD inventory is the effect.

In conclusion, here are three implications of the above:

1) Anyone who claims that the gold price has trended lower over the past few years due to the selling of gold from GLD’s inventory is getting cause and effect mixed up.

2) Anyone who claims that gold is being removed from GLD’s inventory to satisfy demand in Asia (or elsewhere) is either clueless about how ETFs work or is telling untruths to promote an agenda.

3) The early-August decline in GLD’s bullion inventory to a new multi-year low was consistent with the price action. It was evidence that GLD traders were getting increasingly bearish in reaction to lower prices. They loved it at $1600-$1900 and they hated it below $1100.

Print This Post Print This Post

Everything is obvious with the benefit of hindsight

August 19, 2015

Almost every major price move in the financial markets looks predictable after it happens. This is called “hindsight bias”, which is defined thusly at Wikipedia:

Hindsight bias, also known as the knew-it-all-along effect or creeping determinism, is the inclination, after an event has occurred, to see the event as having been predictable, despite there having been little or no objective basis for predicting it.

Almost everyone suffers from hindsight bias to some degree. Of special relevance to me, many newsletter writers and other commentators on the financial markets are afflicted by it. After the event they are quick to explain how a big price move was totally predictable, but often forget to explain why they didn’t predict it ahead of time or perhaps even predicted the opposite of what happened.

It’s important to recognise hindsight bias when it occurs in the market-related opinions/analyses/ramblings you read and when it occurs in yourself. And with regard to the latter it is important not to beat yourself up or wallow in regret when the future turns out to be different from what you expected. Regardless of how predictable an outcome appears to have been with the benefit of hindsight, you can be sure that prior to it happening there were other realistic possibilities. It’s just that these other possibilities shrank to nothingness when they didn’t happen.

The best way to deal with the fact that nothing is certain without the benefit of hindsight is to simply accept the possibility that the future will not pan-out as you expect and position yourself accordingly. In particular, don’t bet so heavily on a specific outcome that you will be financially devastated if something different happens.

Print This Post Print This Post

Basic Gold Market Facts

August 18, 2015

Here are ten basic gold-market realities that are either unknown or ignored by many gold ‘experts’.

1. Supply always equals demand, with the price changing to maintain the equivalence. In this respect the gold market is no different from any other market that clears, but it’s incredible how often comments like “demand is increasing relative to supply” appear in gold-related articles.

2. The supply of gold is the total aboveground gold inventory, which is currently somewhere in the 150K-200K tonne range. Mining’s contribution is to increase the aboveground inventory by about 1.5% each year. An implication is that there should never be a shortage of gold.

3. Although supply always equals demand, the price of gold moves due to sellers being more motivated than buyers or the other way around. Moreover, the change in price is the only reliable indicator of whether the demand side (the buyers) or the supply side (the sellers) have the greater urgency. An implication is that if the price declines over a period then we know, with 100% certainty, that during this period sellers were more motivated (had greater urgency) than buyers.

4. No useful information about past or future price movements can be obtained by counting-up the amount of gold bought/sold in different parts of the gold market or different parts of the world. An implication is that the supply/demand analyses put out by GFMS and used by the World Gold Council are generally useless in terms of explaining past price moves and assessing future price prospects.

5. Demand for physical gold cannot be satisfied by “paper gold”.

6. Prices in the physical and paper (futures) markets are linked by arbitrage trading. For example, if speculative selling in the futures market drives the futures price down relative to the physical (or cash) price by a sufficient amount then arbitrage traders will profit by selling the physical and buying the futures, and if speculative buying in the futures market drives the futures price up relative to the physical (or cash) price by a sufficient amount then arbitrage traders will profit by selling the futures and buying the physical.

7. The change in the spread between the cash price and the futures price is the only reliable indicator of whether a price change was driven by the cash/physical market or the paper/futures market.

8. In a world where US$ interest rates are much lower than usual, the difference between the price of gold in the cash market and the price of gold for future delivery will usually be much smaller than usual. In particular, when the T-Bill yield is close to zero, as is the case today, there will typically be very little difference between the spot price of gold and the price for delivery in a few months. An implication is that in the current financial environment the occasional drift by gold into “backwardation” (the futures price lower than the spot price) will not be anywhere near as significant as it would be under more normal interest-rate conditions.

9. Major trends in the US$ gold price are determined by changes in the general level of confidence in the Fed and the US economy. An implication is that major price trends have nothing to do with changes in jewellery demand, mine supply, scrap supply, central bank buying/selling, and the amounts of gold being imported by India and China.

10. The amount of gold in COMEX warehouses and the inventories of gold ETFs follow the major price trend, meaning that changes in these high-profile inventories are effects, not causes, of changes in the gold price.

Print This Post Print This Post

Facts, Opinions, and Risk Management

August 14, 2015

Commentators on the financial markets often make statements like “it’s a bull market” and “the trend is up” as if these were indisputable facts, but such statements are always opinions.

A statement of fact could reasonably be phrased along the lines of “the market was in an upward trend between date X and date Y”, because if a sequence of rising lows and rising highs occurred between two dates then the trend was, by definition, up during that period. However, it is impossible to know the direction of a market’s current price trend with absolute certainty, let alone the direction of its future price trend. The reason is that even if a market has just made a new high/low there will be some chance that this will turn out to be the ultimate high/low.

For example, it’s a fact that gold was in a bear market in US$ terms from its peak in September of 2011 through to 24th July 2015 (when it hit a 4-year low of $1072), but it is a matter of opinion as to whether gold is now in a bear market. The bear market could obviously still be in progress, but there is also a possibility that it ended on 24th July 2015. At the time of writing, nobody knows for sure.

Some market participants and commentators will draw a line on a chart and then make a statement such as “I will consider the trend to be up (or down) unless the market proves otherwise by moving below (or above) my line”. Fine, but there’s a big difference between claiming to know the direction of the price trend and working under the assumption that the trend is in a particular direction unless/until proven otherwise by some predetermined event. The valley of shattered financial dreams is littered with traders who were determined to stay ‘long’ or ‘short’ because they thought they KNEW the direction of the price trend.

The impossibility of knowing whether a bull/bear market or an up/down trend is going to continue, or even whether the market is currently in bull or bear mode, makes risk management essential. Someone who knew the future would never have to bother with risk management; they could, instead, risk everything on a particular outcome because for them it wouldn’t be a risk at all. But ordinary mortals always face a degree of uncertainty when making investment decisions and, as a result, always need to face the reality that these decisions could prove to be wrong. Be wary, then, of advisors who claim that there is only one possible direction for the future price of an investment.

But while unwillingness to acknowledge the possibility of being wrong is a defect in the approach of some investors, other investors suffer from the opposite problem in that they have a hard time maintaining a bullish or bearish view unless that view is continually being validated by the price action. That is, they are incapable of remaining confident in any opinion that doesn’t happen to conform to the current opinion of the manic-depressive mob. As a result they routinely get ‘sucked in’ following large price rises and ‘blown out’ following large price declines, as opposed to taking advantage of the mob’s proclivity to be wrong.

Therefore, as investors the challenge we all face is to strike a balance between staying the course in rough weather and preparing ourselves for the possibility that there could be unseen rocks up ahead.

Print This Post Print This Post

Bearish divergences at gold-mining bottoms

August 11, 2015

A bullish divergence between the gold-mining sector of the stock market, as represented by the HUI and/or the XAU, and gold bullion involves the gold-mining sector having an upward bias while gold bullion has a downward bias or the gold-mining sector making a higher low while the bullion market makes a lower low. However, bullish divergences often don’t happen around major price bottoms. In fact, it is not uncommon for a major price bottom in gold-related investments to be preceded by a bearish divergence between the gold-mining indices and the metal. To be more specific, it is not uncommon for the gold-mining indices to be weak relative to gold bullion right up to the ultimate price bottom, at which point they suddenly become relatively strong.

Here are charts showing two historical examples of what I am referring to, either of which could be relevant to the present situation. The first chart shows the continuing downward bias in the XAU along with an upward bias in the US$ gold price in the weeks leading up to the XAU’s July-1986 bottom. The July-1986 bottom was followed by a huge multi-quarter rally in the gold-mining sector. The second chart shows the relentless decline in the HUI along with a flat gold price in the weeks leading up to the HUI’s November-2000 bottom. The November-2000 bottom was also followed by a huge multi-quarter rally in the gold-mining sector. The rally from the July-1986 bottom turned out to be the bear-market variety whereas the rally from the November-2000 bottom turned out to be the first leg of a new bull market, but from a practical speculation perspective an X% gain in a bear market is just as good as an X% gain in a bull market.

XAU_1986_110815

HUI_2000_070815

For comparison purposes, here is a chart showing the present situation.

HUI_gold_110815

It’s obviously too soon to know if the 10th August rebound in the gold-mining sector marked the start of a multi-quarter rally or even a 1-2 month rally, but the potential is there.

Print This Post Print This Post

Can the US economy survive more of the Fed’s monetary support?

August 8, 2015

This post is a slightly-modified excerpt from a recent TSI commentary.

Everybody knows that the Fed will eventually hike its targeted interest rate. When it comes to rate hikes, the only unknowns involve timing. What hardly anybody knows is that the Fed’s interest-rate suppression has damaged the economy and that the longer it continues, the weaker the economy will get.

Based on the wording of last week’s FOMC statement it is still likely, but far from a certainty, that the first rate hike will happen in September. That is, the timing of the Fed’s first rate hike remains unknown. The bigger unknown, however, is the timing of the Fed’s second rate hike. The reason is that there could be a large gap between the first and second hikes as a jittery Fed takes its time assessing the effects of the first hike. It could also be a case of “one and done”.

There have recently been numerous comments in the press to the effect that the Fed should stay with its zero% target, the reasoning being that the US economy is not yet strong enough to cope with even the smallest of rate hikes. This is downright weird, given that the economy is supposedly now 6 years into a recovery from the 2007-2009 recession. Just to be clear, I am referring to comments that there SHOULD be no rate hike in the near future, not to comments that there WILL be no rate hike in the near future. The first type of comment is a policy recommendation based on the wrongheaded theory that keeping the Fed Funds Rate at zero will help the economy, whereas the second type of comment is based on the recognition that the Fed’s senior management is guided by wrongheaded theory.

Not to put too fine a point on it, only someone who is economically illiterate could believe an economy can be helped by forcing the risk-free short-term interest rate down to zero and holding it there for years. The reality is that when a central planner distorts price signals it causes investing errors in the affected parts of the economy, and when a central planner distorts the most important of all prices (the price of credit) it leads to investing errors across the entire economy. Many economists, and as far as I can tell all Keynesian economists, haven’t figured this out because their analyses are based on models that treat the economy as if it were an amorphous mass instead of what it is — an extremely complex network comprised of millions of individuals making decisions for their own reasons.

Strangely, the commentators on the financial world who claim that the Fed should continue its Zero Interest Rate Policy haven’t put two and two together. They haven’t twigged that it’s not a fluke that the greatest experiment in money-pumping and interest-rate suppression in the Fed’s history coincided with the weakest post-recession recovery since the 1930s. It’s not a fluke because the extraordinary stimulus is the main cause of the apparent inability of the economy to get out of its own way. A former Fed chairman (now blogger) and current Fed officials routinely take bows for having brought the economy back to health, and yet over the past three years the compound annual growth rate of real US GDP has been slightly less than 2%/year using the government’s estimate of “inflation” and probably around 0%/year using a more realistic estimate of “inflation”. And this 3-year period should have been the sweet spot of the post-2009 economic expansion!

To be fair, the failure to link the weakness of the recovery with the dramatic scale of the policy response is not actually strange. It is, in fact, completely understandable. After all, if the economic model to which you are totally committed is based on the assumption that money-pumping and interest-rate suppression give the economy a sustainable boost, then an unusually weak economy in the wake of aggressive intervention of this nature can only mean two things. It can only mean that the situation would have been even worse without the intervention and that the problem was too little, not too much, monetary accommodation.

It’s testament to the resilience of whatever capitalist elements remain that the Fed hasn’t yet driven the US economy into the ground. There must, however, be a limit to the amount of monetary accommodation (that is, to the amount of price falsification) that the economy can withstand. I wonder what that limit is. Unfortunately, by the looks of things we are going to find out.

Print This Post Print This Post

The amazing inability to see the Fed’s money creation

August 5, 2015

The belief that the Fed’s QE (Quantitative Easing) does not directly boost the US money supply remains popular, even though it is obviously wrong. This is remarkable. It’s even more remarkable, however, that this wrongheaded belief is dearly held by some analysts who are generally astute, a fact I was reminded of when reading a recent post by Doug Noland.

The above-linked Noland post contains the following quote from Russell Napier. The quote is extraordinary due to a) the large number of errors that have been crammed into a few lines, b) the supreme confidence with which blatantly-wrong information is stated, and c) the fact that Russell Napier usually comes across as a smart analyst.

Most investors still believe that we live in a fiat currency world. They believe central bankers can create as much money as they believe to be necessary. Such truths are on the front page of every newspaper, but they may contain just as much truth as the headlines of their tabloid cousins. A belief in this ability to create money is the biggest mistake in analysis ever identified by this analyst. The first reality it ignores is that money, the stuff that buys things and assets, is created by an expansion of commercial bank, and not central bank, balance sheets. The massively expanded central bank balance sheets have not lifted the growth in broad money in the developed world above tepid levels. Until that happens, developed world monetary policy must be regarded as tight and not easy.

This quote is a mindboggling display of ignorance regarding the mechanics of the Fed’s QE, but Doug Noland describes it as “thoughtful and important analysis”. As they say in Thailand, oh my Bhudda! Doug Noland, another smart analyst, apparently also labours under false beliefs regarding the relationship between the Fed’s QE and the US money supply.

The Fed’s money-creation process is not that complicated. There’s certainly no good reason why professional financial-market analysts couldn’t or shouldn’t be familiar with it. I explained the process in some detail in a blog post on 16th February.

Moreover, even an analyst who doesn’t understand the mechanics of the QE process should be able to see, via a quick look at the money-supply and bank credit data, that there has been a lot more money creation in the US over the past several years than can be explained by the expansion of commercial bank balance sheets. For example, the red line on the following chart shows that from the beginning of 2009 through to the end of 2011 the total quantity of US commercial bank credit grew by only $100B (from $9.3T to $9.4T) while the blue line on the chart shows that over the same 3-year period the US money supply (currency in circulation outside the banking system + commercial-bank demand deposits + commercial-bank savings deposits) grew by $2.4T. If not from the Fed, where did the $2.3T of money-supply expansion that cannot be explained by commercial-bank credit expansion come from?

TMS_bankcredit_050815

Not coincidentally, the amount by which the increase in commercial-bank credit falls short of the increase in the money supply is approximately the same as the increase in Fed credit. This is not a coincidence because the Fed created the money.

Print This Post Print This Post

The gold supply-demand nonsense is relentless

August 4, 2015

In a blog post a couple of weeks ago I noted that it’s normal for large and fast price declines in the major financial markets to be accompanied by unusually-high trading volumes, meaning that it’s normal for large and fast price declines in the major financial markets to be accompanied by increased BUYING. I then wondered aloud as to why it is held up as evidence that something nefarious or strange is happening whenever an increase in gold buying accompanies a sharp decline in the gold price. Right on cue, ZeroHedge.com (ZH) has just published an article marveling — as if it were an inexplicable development — at how the recent sharp decline in the gold price was accompanied by an increase in buying.

As is often the case in the realm of gold-market analysis, the ZH article incorrectly conflates volume and demand. The demand for physical gold must always equal the supply of physical gold, with the price rising or falling by the amount needed to maintain the balance. If sellers are more motivated than buyers, then price will have to fall to restore the balance. The key point to understand here is that for every buyer there must be seller, and vice versa, so the purchase/sale of gold does not indicate a change in overall demand — it only indicates a fall in demand on the part of the seller and an exactly offsetting increase in demand on the part of the buyer. It is also worth noting — even though it should be obvious — that demand for physical gold cannot be satisfied by paper gold.

Trading in paper gold (gold futures, to be specific) clearly does have an effect on the price at which physical gold changes hands. The paper and physical markets are inextricably linked, but this link does not make it possible for the demand for physical gold to rise relative to the supply of physical gold in parallel with a falling price for physical gold.

What happens in the real world is that when the futures market leads the physical market higher or lower it changes the spread between the spot price and the price for future delivery. For example, when the gold price is being driven downward by speculative selling in the futures market, the price of gold for future delivery will fall relative to the spot price. In a period when risk-free short-term interest rates are being pegged at or near zero by central banks, this can result in the spot price becoming higher than the price of gold for delivery in a few months’ time. This creates a financial incentive for other operators in the gold market to buy gold futures and sell physical gold. For another example, when the gold price is being driven upward by speculative buying in the futures market, the price of gold for future delivery will rise relative to the spot price. This creates a financial incentive for other operators in the gold market to sell gold futures and buy physical gold.

The bullion banks are the “other operators”. They tend to focus on trading the spreads between the physical and futures markets. In doing so they position themselves to make a small percentage profit regardless of the price trend and therefore tend to be agnostic with regard to the price trend.

After harping on about the dislocation between the physical and paper gold markets, a dislocation that doesn’t actually exist but makes for good copy in some quarters, the above-mentioned ZH article moves on to the level of the CME (often still referred to as the COMEX) gold inventory. To the sound of an imaginary drumroll, the author of the article breathlessly points out that the amount of “registered” gold at the COMEX has dropped to a 10-year low and that the amount of “open interest” in gold futures is now at a 10-year high relative to the amount of “registered” gold.

The information is correct, but isn’t relevant other than as a sentiment indicator. It’s a reflection of what has happened to the price over the past few weeks and the increase in negativity that occurred in reaction to this price move. It is not evidence of physical-gold scarcity.

I currently don’t have the time to get into any more detail on the COMEX inventory situation. However, if you are interested in delving a little deeper you could start by reading the July-2013 article posted HERE. I get the impression that this article was written in response to the scare-mongering that ZH was doing on the same issue two years ago.

Thanks largely to the unprecedented measures taken by the senior central banks over the past few years, there have been many strange happenings in the financial world. However, the increased buying of physical gold in parallel with a sharply declining gold price and the reduction in COMEX “registered” gold cannot be counted among them.

Print This Post Print This Post

Is the Fed privately owned? Does it matter?

August 3, 2015

The answer to the first question is ‘sort of’. The answer to the second question is no. The effects of having an institution with the power to manipulate interest rates and the money supply at whim are equally pernicious whether the institution is privately or publicly owned. However, if you strongly believe that the government can not only be trusted to ‘manage’ money and interest rates but is capable of doing so to the benefit of the economy, then please contact me immediately because I can do you a terrific deal on the purchase of the Eiffel Tower.

The fact is that the Federal Reserve would be a really bad idea regardless of whether it were privately owned or owned by the US government. The question of ownership is therefore secondary and the people who stridently complain about the Fed being privately owned are missing the critical point. In any case and as I explained in an article way back in 2007, the Fed is not privately owned in the true meaning of the word “owned”. For all intents and purposes, it is an agency of the US Federal Government.

In addition to the work of G. Edward Griffin referenced in my above-linked 2007 article, useful information about the Fed’s ownership can be found in a 2010 article posted at the Mises.org web site. This article approaches the Fed’s ownership and control from an accounting perspective, that is, by applying Generally Accepted Accounting Principles (GAAP), and concludes that:

…the Fed, when tested against GAAP as the Fed itself uses it in the Fed’s assessments of those it regulates, is a Special Purpose Entity of the federal government (or, according to the latest definition, is a Variable Interest Entity of the federal government). The rules of consolidation therefore apply, and the Fed must be seen as controlled by federal government, making it indivisibly part of the federal government. The pretence of independence is no more than that, a pretence.

There is, however, no denying that the banks have tremendous vested interest in influencing the policies of the Fed, nor that the power being so narrowly vested in the president makes him a special target for influence. Still, the power to control the Fed is not in the hands of its “owners” but firmly in the hands of the federal government and the president of the United States.

It is clear that the Fed was established by the government at the behest of bankers with the unstated aim of facilitating the expansions of the government and the most influential banks. It is effectively a government agency, but due to the influence that the large banks have on the government it will, if deemed necessary by the Fed Chairman, act for the benefit of these banks at the expense of the broad economy. The happenings of the past eight years should have left no doubt about this.

Print This Post Print This Post