Print This Post Print This Post

The coming plunge in short-term interest rates

December 22, 2022

[This blog post is an excerpt from a recent TSI commentary]

Market interest rates always lead Fed-controlled interest rates at important turning points. Therefore, when trying to figure out whether interest rates have peaked or troughed, don’t look at what the Fed is saying; look at what the markets are saying.

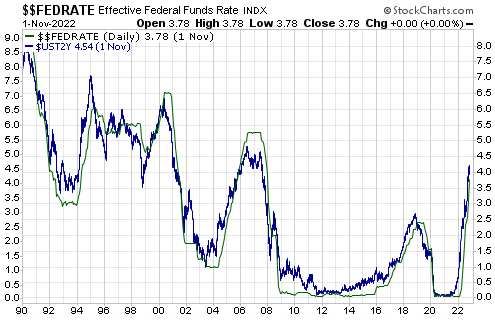
The above statement is illustrated by the following chart comparison of the Fed Funds Rate (the green line), an overnight interest rate totally controlled by the Fed, and the 2-year T-Note Yield (the blue line), a short-term interest rate that is influenced by the Fed but ultimately determined by the market. The chart shows that at cyclical trend changes since the mid-1990s, the 2-year T-Note yield always changed direction in advance of — usually well in advance of — the Fed Funds Rate (FFR). For example, focusing on the downward trend changes we see from the chart that a) the 2-year yield reversed downward in Q4-2018 and the FFR followed in mid-2019, b) the 2-year yield reversed downward in mid-2006 and the FFR followed in mid-2007, and c) the 2-year yield reversed downward in Q2-2000 and the FFR followed in Q4-2000. When the 2-year T-Note yield reversed downward in 2018, 2006 and 2000, the Fed had no idea that within 6-12 months it would be slashing the FFR.
Right now, J. Powell thinks that the Fed is going to hike its targeted interest rates 2-3 more times and then hold them at 5% or more until well into 2024. However, that’s nothing like what the Fed will do if the stock market, the GDP growth numbers, the CPI and the employment data do what we expect over the next few quarters.

Our view is that the US stock market and economy are about to tank due to the decline in the monetary inflation rate that has already occurred, causing market interest rates to fall across the yield curve. Furthermore, the longer it takes for the Fed to wake up to what’s going on, the worse it will be for both the stock market and the economy and the more rapid will be the decline in market interest rates.

The Fed is asleep, but the market has begun to discount the “inflation” collapse and the negative economic news to come. Evidence is the pullback in the 2-year T-Note yield from its high in early-November to below its 50-week MA (the blue line on the following chart). This is the first sustained break below the 50-week MA since the upward trend was established in 2021. A break below the 90-week MA (the black line on the chart) would be a definitive signal that the 2-year yield’s cyclical trend has changed from up to down.
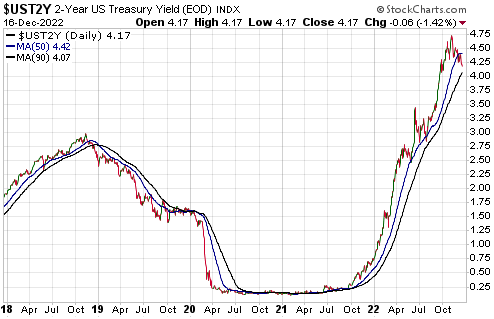
Based on the leads and lags of the past three decades, if the early-November high for the 2-year yield proves to be the ultimate high for the cycle, which it very likely will, then the Fed has made its last rate hike and will be cutting rates by the final quarter of next year. Our guess is that the Fed’s first rate-cut will occur during the second or third quarter of 2023.

Print This Post Print This Post

US Recession Watch

December 7, 2022

[This blog post is an excerpt from a commentary published at TSI on 4th December]

At least one of two things should happen to warn that an official US recession is about to begin. One is a decline in the ISM Manufacturing New Orders Index (NOI) to below 48 and the other is a reversal of the yield curve’s trend from flattening/inverting to steepening. For all intents and purposes the first signal triggered in July-2022 when the NOI dropped to 48, whereas the second signal probably won’t trigger until the first half of next year.

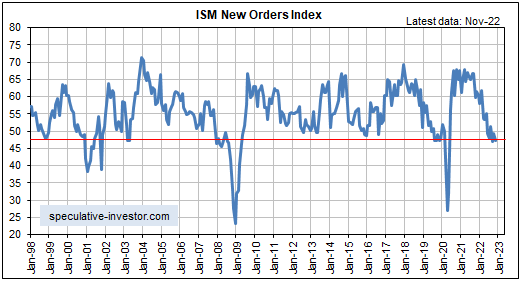
The following monthly chart shows that the NOI dropped to a cycle low of 47.1 in September-2022, ticked up in October and returned to its cycle low in November, leaving the message unchanged. The NOI is signalling that a recession has started or will start soon.

The following chart also shows that the NOI dropped below 40 during the recession period of the early-2000s and dropped below 30 during the 2007-2009 Global Financial Crisis and the 2020 COVID lockdowns. We expect that it will drop below 30 next year.

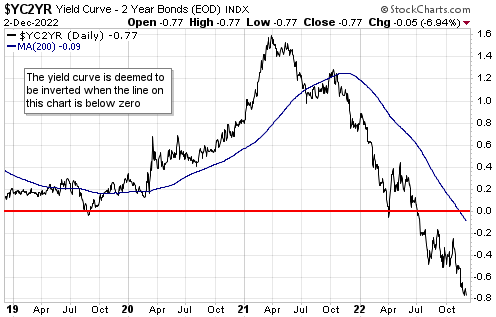
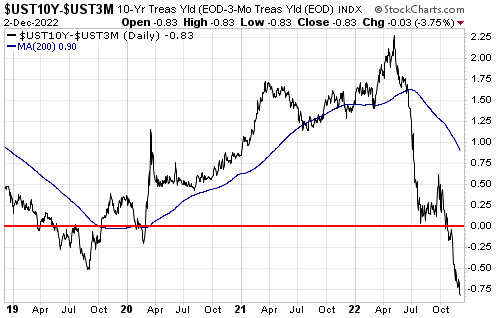
The first of the two daily charts displayed below shows that the 10yr-2yr yield spread, our favourite yield curve indicator, plunged well into negative (inverted) territory during July and remains there. The second chart shows that the 10yr-3mth yield spread, which apparently is the Fed’s favourite yield curve indicator, finally followed suit over the past two months and is now as far into inverted territory as the 10yr-2yr spread.

One of our consistent messages over the past few months has been that a more extreme inversion of the US yield curve would occur before there was a major reversal to steepening. There were two reasons for this. First, the monetary inflation rate (the primary driver of the yield curve) was set to remain in a downward trend until at least early-2023. Second, it was likely that declining inflation expectations would put downward pressure on yields at the long end while the Fed’s rate-hiking campaign supported yields at the short end. For these reasons, we wrote over the past few months that by early 2023 both the 10yr-2yr and 10yr-3mth spreads could be 100 basis points into negative (inverted) territory.

As recently as two months ago our speculation that the 10yr-2yr and 10yr-3mth spreads would become inverted to the tune of 100 basis points (1.00%) by early-2023 looked extreme, especially since the 10yr-3mth spread was still above zero at the time. With both of these spreads now having become inverted by around 80 basis points, that’s no longer the case.

We doubt that the aforementioned yield spreads will move significantly more than 100 basis points into negative territory, because we expect that during the first quarter of next year economic reality (extreme weakness in the economic statistics and the stock market) will hit the Fed like a ton of bricks. This should bring all monetary tightening efforts to an abrupt end, causing interest rates at the short end to start falling faster than interest rates at the long end, that is, causing the yield curve to begin a major steepening trend.

Our conclusion over the past four months has been that the US economy had commenced a recession or would do so in the near future. Due to recent up-ticks in some coincident and lagging economic indicators, we now think that the first quarter of 2023 is the most likely time for the official recession commencement.

Print This Post Print This Post