Print This Post Print This Post

The status of gold’s “true fundamentals”

April 18, 2022

My Gold True Fundamentals Model (GTFM) takes into account the seven most important fundamental drivers of the US$ gold price (the real interest rate, the yield curve, credit spreads, the relative strength of the banking sector, the strength of growth stocks relative to defensive stocks (an indicator of whether the financial world is tilting towards growth or safety), the general trend in commodity prices and the bond/dollar ratio) to arrive at a number between 0 and 100 that indicates the extent to which the fundamental backdrop is gold-bullish. 100 signifies maximum bullishness and 0 signifies minimum bullishness (maximum bearishness).

Although it can be helpful in figuring out when to buy/sell gold-related investments, the GTFM is not designed to be a market timing indicator. Instead, it indicates the direction of the pressure on the gold price being exerted by the fundamentals that matter.

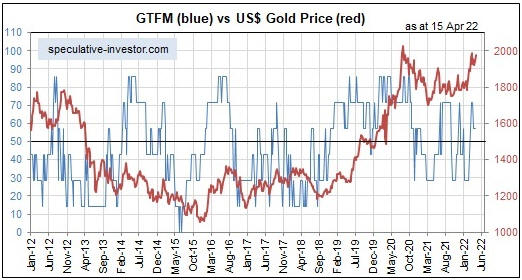
The most recent significant shift in the GTFM (the blue line on the following weekly chart) was from bearish to bullish during the second half of February this year. Four of the seven inputs to the GTFM are bullish at this time, so the Model’s output remains in bullish territory.

GTFM_180422

I expect that the GTFM will move a little further into bullish territory within the coming month due to the Yield Curve input (one of the three currently-bearish inputs) flipping to bullish.

There are three ways that the Yield Curve input to the GTFM could turn bullish within the next few weeks, one or two of which probably will happen. One way is for the 10Y-2Y yield spread to become more inverted than it was in late-March. A second way is for the 10Y-2Y yield spread to signal the start of a steepening trend, which at this point of the cycle also would be a recession warning. A third way is for the 2-year T-Note yield to generate preliminary evidence of a downward trend reversal, which it could do by moving below its 50-day MA.

The following chart of the 2-year T-Note yield shows that the 50-day MA is a long way below the current yield. However, it is rising rapidly and should be above 2% by the end of this month.

UST2Y_180422

Given what’s happening in related markets, I expect that the GTFM’s February-2022 upward reversal and shift into bullish territory will prove to be sustainable, meaning that I expect the gold market to have a fundamental tailwind for at least several more months.

Print This Post Print This Post

A secular trend has changed

April 10, 2022

[This blog post is an excerpt from a recent TSI commentary]

For 36 years the yield on the 10-year T-Note moved lower within the channel drawn on the following chart. Depending on how the lines are drawn, an upside breakout from this channel may or may not have just occurred. If an upside breakout has occurred or occurs later this year following a pullback over the next few months, would this confirm the end of the secular downward trend in interest rates?

UST10Y_blog_110422

It’s not that simple. Obviously, an upside breakout from the long-term channel would be consistent with the trend having changed from down to up, but prices often generate misleading signals via failed breaks below chart-based support or above chart-based resistance. However, there are fundamental reasons to be confident that a long-term trend change has occurred.

The fundamental reasons revolve around the monetary and fiscal responses to the pandemic in 2020, which in combination created such a massive inflation problem that the forces putting downward pressure on interest rates have been overwhelmed. The official response to COVID wasn’t the straw that broke the camel’s back, it was the bazooka that blew the camel to pieces.

There were two parts to the official COVID response that set the stage for a directional change in the secular interest-rate trend. First, there was the imposition of widespread lockdowns that caused the prices of most commodities to collapse and prompted a panic into Treasury securities, leading to a blow-off move to the downside in Treasury yields. Second, there was the effort by the Fed and the government to mitigate the short-term pain stemming from the lockdowns, which involved expanding the total US money supply by 40% in less than a year and ‘showering’ the population with money. The effort was very successful at mitigating short-term pain, but at the expense of economic progress and living standards beyond the short-term. The adverse effects of the actions taken to reduce/eliminate short-term pain during 2020 and the first half of 2021 will be evident for many years to come.

We thought that the secular downward trend in interest rates had ended shortly after the blow-off move in Q1-2020, and this opinion has been subsequently supported by a lot of evidence. However, all secular trends have tradable countertrend moves. We are anticipating a tradable move to the downside in US government bond yields over the next several months.

Print This Post Print This Post