Print This Post Print This Post

Revisiting the most important gold fundamental

June 23, 2021

There are seven inputs to my Gold True Fundamentals Model (GTFM), one of which is an indicator of US credit spreads (a credit spread is the difference between the yield on a relatively high-risk bond and the yield on a relatively low-risk bond of the same duration). In a blog post on 12th April I wrote that if I had to pick just one fundamental to focus on at the moment, it would be credit spreads.

The average credit spread is the most reliable indicator of economic confidence. When economic confidence is high or in a rising trend, credit spreads will be narrow or in a narrowing trend. And when economic confidence is low or in a declining trend, credit spreads will be wide or in a widening trend. It therefore isn’t surprising that over the past 25 years there was a pronounced rise in US credit spreads prior to the start of every period of substantial weakness in the US economy and every substantial gold rally. This is as it should be.

Credit spreads being narrow or in a narrowing trend is a characteristic of an economic boom caused by creating lots of money out of nothing. In fact, the main reason for the popularity of inflation policy (pumping up the money supply) is that the policy initially leads to rising economic confidence as evidenced by narrowing credit spreads. It is only much later that the negative effects of the policy bubble to the surface, but by then enough time will have passed that the link between cause and effect will be obscured and the negative effects can be blamed on exogenous events as opposed to bad policy.

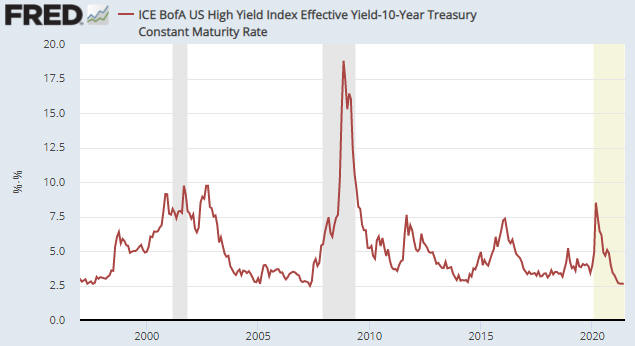
In my 12th April post I included a chart that showed a proxy for the average US credit spread. The chart’s message at the time was that credit spreads had been in a strong narrowing trend (reflecting rising economic confidence) for about 12 months and had become almost as low/narrow as they ever get. This implied that anyone who over the preceding several months had been betting on a large stock market decline or a large rally in the gold price had been betting against both logic and history. I pointed out that economic confidence was probably about as high as it would get, but that it could stay at a high level for more than a year.

An update of the same chart is displayed below. It shows that nothing has changed, in that over the ensuing period credit spreads essentially drifted sideways near their multi-decade lows. This means that the economic boom remains in full swing.

CreditSpread_230621

During an economic boom it isn’t a good idea to trade gold from the long side, except for the occasional multi-month trade after the gold market becomes ‘oversold’ in sentiment and momentum terms. However, if the economic boom is accompanied by rising inflation expectations and interest rates, as is the case with the boom that kicked off last year, it usually will pay to be long industrial commodities in general and energy in particular.

Print This Post Print This Post

When will the next US recession begin?

June 7, 2021

[This blog post is an excerpt from a TSI commentary published last week]

Our view for the past 11-12 months has been that last year’s US recession ended in June plus/minus one month, making it the shortest recession in US history. The latest leading economic data indicate that the recovery is intact and that the strong GDP growth reported for the first quarter of this year will continue.

Of particular relevance, the following monthly chart shows that the ISM New Orders Index (NOI), one of our favourite leading economic indicators, remains near the top of its 20-year range. The ISM NOI leads Industrial Production by 3-6 months.

The performances of leading and coincident economic indicators show that the US economy remains in the boom phase of the boom-bust cycle, meaning that the economic landscape remains bullish for industrial commodities relative to gold. Therefore, the small amount of relative strength demonstrated by gold over the past two months is probably part of a countertrend move that will run its course within the next three months.

A year ago our view was that there would be a strong rebound in economic activity fueled by monetary stimulus, fiscal stimulus and the release of pent-up demand after COVID-related restrictions were removed, but that the rebound would be short-lived. Specifically, we were looking for the US economy to recover rapidly during the second half of 2020, level off during the first half of 2021 and return to recession territory by the first half of 2022. This view was revised in response to leading indicators and by October of last year we were expecting the period of strong growth to extend through the first half of 2021.

Based again on leading indicators, we now expect the period of above-average GDP growth to continue throughout 2021, albeit with a slower growth rate during the second half than during the first half. Furthermore, the probability of the US economy re-entering recession territory as soon as the first half of 2022 is now extremely low. To get a recession within the next 12 months there will have to be another shock of similar magnitude to the virus-related lockdowns of 2020.

As far as what happens beyond the first half of next year, it’s largely pointless trying to look that far ahead. One thing we can say is that the current position of the yield curve suggests that the next US recession will not begin earlier than 2023. To further explain this comment we will make use of the following chart of the US 10yr-2yr yield spread, a good proxy for the US yield curve.

A major yield-curve trend reversal from flattening (indicated by a falling line on the chart) to steepening (indicated by a rising line on the chart) generally occurs during the 6-month period prior to the start of a recession. After that, what tends to happen is:

a) The yield curve steepens throughout the recession and for 1-2 years after the recession is over.

b) The yield curve peaks and a long (3-year +) period of curve flattening gets underway.

c) The curve eventually gets as flat as it is going to get and reverses direction, warning that a recession will begin within the ensuing 6 months.

Currently, there is a lot of scope for curve steepening prior to peak ‘steepness’. To be more specific, right now the 10-year T-Note yield is about 1.5% above the 2-year T-Note yield, but previous periods of curve steepening didn’t end until the 10-year T-Note yield was at least 2.5% above the 2-year T-Note yield. Moreover, history tells us that there will be a multi-year period of curve flattening between the peak in yield-curve steepness and the start of a recession.

We expect that the current economic cycle will be compressed, but it still could take years for the yield curve to return to the position where it is warning of recession.

Due to unprecedented manipulation of interest rates it could be different this time, meaning that the end of the current boom could coincide with a yield curve that contrasts with the typical pre-recession picture. However, regardless of what happens to the yield curve near the end of the current boom there will be timely warnings of a boom-to-bust transition in the real-time data, including an upward reversal in credit spreads. At the moment, such warnings are conspicuous by their absence.

Print This Post Print This Post