Print This Post Print This Post

Gold and the ‘Real’ Interest Rate Revisited

November 18, 2019

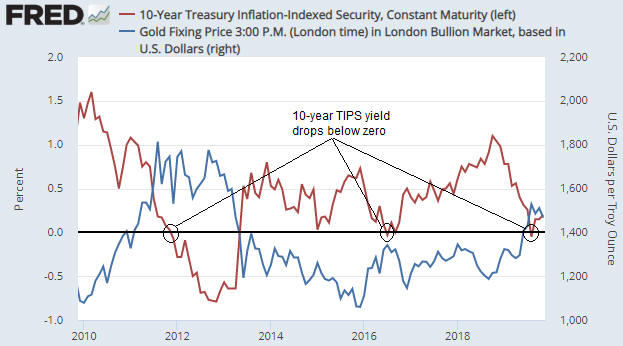
In a blog post in early-September I noted that the 10-year TIPS (Treasury Inflation Protected Security) yield had just gone negative and that the previous two times that this proxy for the real interest rate went negative (August-2011 and July-2016) the gold price was at an important peak. I then attempted to answer the question: If gold tends to benefit from a lower real interest rate, why would the gold price reverse downward shortly after the real interest rate turned negative?

In the earlier post I gave three reasons why a downward reversal in the gold price could coincide with the ‘real’ interest rate going negative. They were:

1) The dip into negative territory marked a low point for the real interest rate.

2) The real interest rate is just one of several fundamental gold-price drivers, so the upward pressure on the gold price exerted by a falling real interest rate could be counteracted by the downward pressure exerted by other fundamental influences.

3) The gold-bullish fundamental backdrop had been fully discounted by the current gold price.

At the time I thought that the third of the above-mentioned reasons may be applicable, because the speculative net-long position in Comex gold futures was very close to an all-time high and the weekly RSI (an intermediate-term momentum indicator) was almost as high as it ever gets.

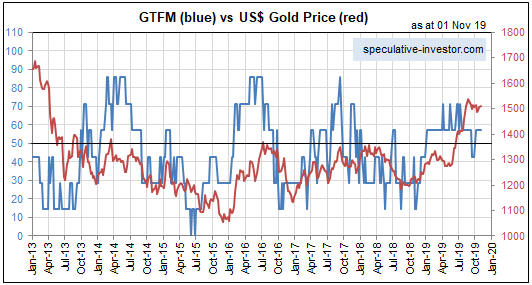
As it turned out, the first and third reasons were applicable. Sentiment and momentum indicators pointed to extreme enthusiasm for gold on the part of the speculating community, and the following chart, which is an update of the chart included in the blog post linked above, shows that the 10-year TIPS yield reversed upward at the beginning of September.

gold_TIPS_181119

The current situation is that neither sentiment nor fundamentals are conducive to substantial strength in the gold price. There could be a counter-trend rebound at any time, but the conditions are not right for a resumption of the major upward trend that got underway in the second half of last year.

Print This Post Print This Post

Gold and Inflation Expectations Revisited

November 11, 2019

In an earlier blog post I discussed the relationship between gold and inflation expectations. Contrary to popular opinion, gold tends to perform relatively poorly when inflation expectations are rising and relatively well when inflation expectations are falling.

The relationship outlined above is very clear on the following charts. The first chart shows that over the past 6 years there has been a strong positive correlation between RINF, an ETF designed to move in the same direction as the expected CPI, and the commodity/gold ratio (the S&P Spot Commodity Index divided by the US$ gold price). In other words, it shows that a broad basket of commodities has outperformed gold during periods when inflation expectations were rising and underperformed gold during periods when inflation expectations were falling. The second chart shows the same comparison over the past 12 months. Notice that inflation expectations bottomed for the year (to date) in mid-August and the commodity/gold ratio bottomed about two weeks later.

GNXgold_IE_6Y_111119

GNXgold_IE_1Y_111119

A large part of the reason for the strong inverse relationship between gold’s relative strength and inflation expectations is the general view that “inflation” of 2%-3% is not just normal, it is beneficial. In fact, most people have been conditioned to believe that it’s a serious economic problem necessitating draconian central bank intervention if money fails to lose purchasing power at a slow and steady pace.

Eventually the rate of “price inflation” will rise to a level where it starts being seen by the public as a major economic problem, and, as a result, the desire to maintain cash savings will enter a steep decline. It is at this point that the relationship depicted above will stop working and the demand for gold will begin to surge in parallel with rising inflation expectations. In other words, at some point the relationship depicted on the above chart will reverse due to declining confidence in the official money. This point probably will arrive within the next 10 years, but probably won’t arrive within the next 12 months. Over the next 12 months it’s likely that gold will continue to be favoured during periods of falling inflation expectations and other commodities will continue to be favoured during periods of rising inflation expectations.

So, if you think that the recent inflation-expectations bounce is the start of a trend then you should be looking for opportunities to increase your exposure to commodities such as oil and copper, not gold. My guess is that inflation expectations bottomed during August-October of this year, but I’m open to the possibility that the bottoming process will extend into early next year.

Print This Post Print This Post

Banks versus Gold, Part 2

November 4, 2019

In a blog post on 30th September I noted that the banking sector (as represented by the US Bank Index – BKX) had begun to show relative strength, a ramification of which was that my Gold True Fundamentals Model (GTFM) had shifted from bullish to bearish. An update is warranted because the situation has changed since then in a way that is both interesting and a little surprising.

Just to recap, the relative performance of the banking sector (as indicated by the BKX/SPX ratio) is an input to my “true fundamentals” models for both the US stock market and the gold market, the difference being that when the input is bullish for one of these markets it is bearish for the other. In particular, relative weakness in the banking sector is considered to be bullish for gold and bearish for general equities.

As explained in the above-linked post, there was enough relative strength in the banking sector during the first half of September to flip the BKX/SPX input from gold-bullish to equity-bullish, causing the GTFM to shift from bullish to bearish. My guess at the time was that the GTFM would return to gold-bullish territory within the next two months, but I pointed out that it is usually better to base decisions on real-time information than on what might happen in the future.

Within a few days of my 30th September post the GTFM shifted back to bullish, where it remains today. This means that apart from a 3-week period during September, the fundamental backdrop has been supportive for gold since the beginning of this year. Refer to the following chart for more detail (the fundamental backdrop is gold-bullish when the blue line on the chart is above 50). Furthermore, there is evidence in the recent price action that gold’s correction is over. However, the fundamental and technical signs of strength in the gold market were not accompanied by signs of weakness in the banking sector.

GTFM_041119

What’s both interesting and a little surprising is that the renewed signs of strength in gold have gone hand-in-hand with additional signs of strength in the banking sector. Specifically, since my 30th September post the BKX has broken out to the upside (refer to the top section of the following weekly chart) and the BKX/SPX ratio has broken a sequence of declining tops that dates back to early last year (refer to the bottom section of the following chart).

BKX_041119

The BKX/SPX ratio is just one of seven inputs to the GTFM, so there are circumstances in which the gold price can trend upward along with relative strength in the banking sector of the stock market. In other words, it isn’t out of the question that over the next few months we will get a gold rally in parallel with a continuing rise in the BKX/SPX ratio and strength in general equities. It’s more likely, however, that the emerging signs of strength in gold are warning of a short-term reversal to the downside in both the broad stock market and the banking sector.

Print This Post Print This Post