Print This Post Print This Post

MMT is now a reality

March 31, 2020

[This blog post is an excerpt from a recent commentary published at TSI]

Modern Monetary Theory (MMT), which isn’t modern and isn’t a theory (in the true meaning of the word), is now being put into practice in many countries, including the US. What’s happening isn’t being called MMT, but that’s what it is.

Under cover of the “coronacrisis”, we are now witnessing the introduction of MMT. Specifically, in an effort to alleviate the short-term pain associated with the economy-wide shut-downs that they are enforcing as part of history’s biggest ever over-reaction, governments are now promising to spend money as if they had access to an unlimited supply of the stuff. They can do this because with the help of the central bank they do have access to an unlimited supply of the stuff.

The US government and the Fed are leading the way and in doing so all lines that are supposed to separate these two organisations are being blurred or eliminated. To put it another way, the pretence that the Fed is independent of the government has been dropped.

First, there’s the $2 trillion “stimulus” package that was just signed into effect by President Trump. How could a government that supposedly had to limit the pace of its deficit spending suddenly decide to instantly triple its deficit? Where is the money coming from to do this? After all, nobody is talking about increasing taxes. On the contrary, there is talk of delaying and reducing taxes. Clearly, the plan is for the money to be created out of nothing by the Fed.

Even more tellingly, there are the programs introduced by the Fed over the past two weeks. These are:

a) The Commercial Paper Funding Facility (CPFF), via which the Fed will buy commercial paper from issuers.

b) The Money Market Mutual Fund Liquidity Facility (MMLF), via which the Fed will lend to financial institutions secured by assets purchased by the financial institution from money market mutual funds.

c) The Main Street Business Lending Program (MSBLP), via which the Fed will lend directly to small and medium-size businesses.

d) The Primary Market Corporate Credit Facility (PMCCF), via which the Fed will buy corporate bonds from issuers.

e) The Secondary Market Corporate Credit Facility (SMCCF), via which the Fed will buy corporate bonds and bond ETFs in the secondary market.

f) The Term Asset-Backed Securities Loan Facility (TALF), via which the Fed will support the issuance of asset-backed securities.

Now, the Fed isn’t supposed to do any of the above, but it is getting around the existing regulations by creating Special Purpose Vehicles (SPVs) that will do the actual buying and lending. The US government will fund these SPVs with initial capital that the Fed will leverage 10:1. That is, for every dollar injected by the government into one of these SPVs, the Fed will create 10 new dollars via the traditional methods of fractional reserve banking.

The truly crazy thing is that the dollars that the government will inject into the Fed’s SPVs were previously created out of nothing when the Fed monetised Treasury securities. So, the Fed creates money out of nothing. This money then goes to the government. The government then deposits some of this money into the Fed’s new SPVs, and based on this injection of ‘capital’ the Fed creates a lot more money out of nothing.

The indirect costs, in terms of reduced productivity, higher unemployment and reduced living standards, of this money creation will be huge and long-lasting, but we’ll leave the discussion of these longer-term issues until after the immediate crisis has abated.

Our main point today is that the method of government funding appears to have changed in a permanent way. No longer will governments feel constrained by their abilities to tax the population and borrow from bond investors. From now on they will act like they have unrestricted access to a bottomless pool of money.

Print This Post Print This Post

The inflation expectations crash and what it portends

March 24, 2020

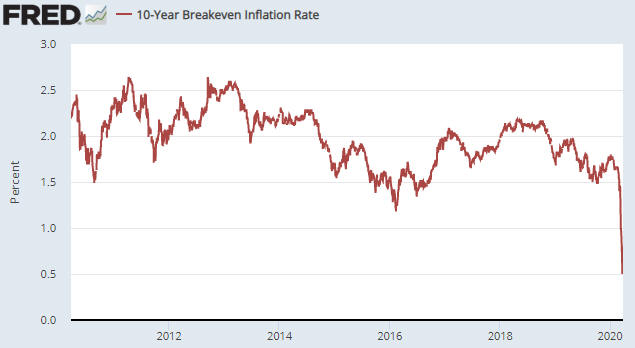
Inflation expectations have crashed along with the stock market and the oil price. This is evidenced by the following chart of the 10-Year Breakeven Inflation Rate, which indicates the average CPI that the market expects the government to report over the years ahead. Since the advent of the TIPS (Treasury Inflation Protected Securities) market in 2003, the Expected CPI was only below last Friday’s level of 0.50% during November-December of 2008 and January of 2009, that is, during the concluding months of the Global Financial Crisis.

10yrExpCPI_240320

The collapse in inflation expectations over the past several weeks does not indicate that “inflation” will be much lower in the future. On the contrary, beyond the short-term it greatly increases the risk of higher “inflation”.

Over the next few months the CPI will be lower than would have been the case in the absence of the coronavirus-related restrictions to economic activity and the plunge in the oil price, but by this time next year the CPI probably will be much higher due to the following:

1) Aggressive central bank reactions to the economic slowdown and the stock market plunge. These reactions will distort prices and hamper the economy, but to a man with nothing except a hammer every problem looks like a nail. To a central banker, every economic problem other than obvious “price inflation” looks like a reason to create more money and credit out of nothing. Also, to the central bankers of the world the recent rapid decline in inflation expectations is like a giant cattle prod pushing them in the direction of pro-inflation monetary policy.

2) In addition to aggressive monetary stimulus there will be aggressive fiscal stimulus. This would be the case anyway under such circumstances, but in the US the short-term stimulus from increased government spending will be more aggressive than usual due to this being an election year.

3) Once the coronavirus threat dissipates, there will be the natural release of pent-up demand.

4) The widespread shutting down of mines, production facilities and trade-related transportation will damage supply chains, in some cases permanently due to parts of ‘chain’ going bust, and ensure that it will take more time than usual for producers to respond to increased demand and rising prices.

Adding the natural force of pent-up demand release to the unnatural forces of monetary/fiscal stimulus and supply disruptions resulting from forced shut-downs should mean that “inflation” will be materially higher a year from now than would have been the case in the absence of the Q1-2020 calamity. My prediction: During the first half of 2021 the official US CPI, which routinely understates the increase in the cost of living, will print above 4%.

Print This Post Print This Post

A strangely successful gold stock model

March 16, 2020

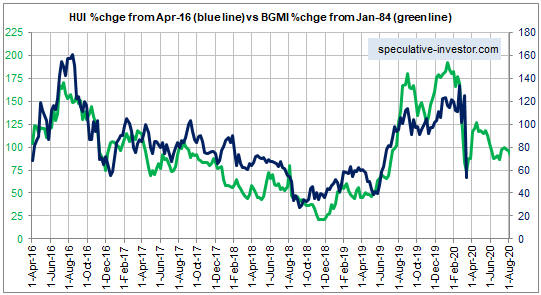
In TSI commentaries since May-June last year I have been tracking the current performance of the gold mining sector with its performance during the mid-1980s. More specifically, I have been comparing the current HUI with the mid-1980s Barrons Gold Mining Index (BGMI). The chart that illustrates this model is displayed below.

The model predicted the rapid rise in the HUI during June-August of last year, the steep correction from a peak by early-September to an October-November low, the rise to a new multi-year high by January-2020 and the crash to a low in March-2020. The big predictions associated with this model are now in the past, which is why I can take the liberty of including it in a free blog post.

The main point I want to make with this post is that even though the present often looks very different from any previous time, the bulk of what happens in the financial markets has happened before. It’s often just a matter of finding the right historical comparison, which is always easier said than done. Also, valid comparisons with previous times always have limited lifespans. It’s possible, for example, that my comparison with the mid-1980s has almost reached the end of its useful life.

Knowledge of how markets have performed in the past, including the distant past (not just the preceding 10-20 years), is useful even if it doesn’t lead to a specific history-based model. For example, anyone with knowledge of market history knows that when the gold mining sector is stretched to the upside near the start of a general stock market crash, it always crashes with the broad market. As far as I know, there have been no exceptions.

History informs us that after a crash comes a rebound and after a rebound there is usually a test of the crash low.

Print This Post Print This Post

Gold versus Silver

March 2, 2020

[This blog post is a modified excerpt (with an updated chart) from a TSI commentary published one month ago]

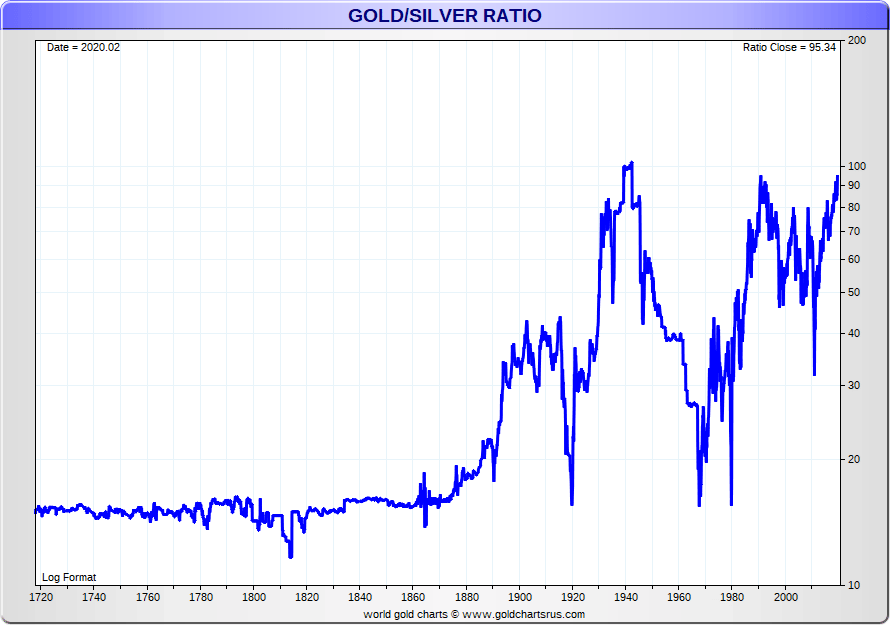
Last July the gold/silver ratio came within 10% of its 50-year high, which was reached in 1991, and within 15% of its multi-century high, which was reached in the early 1940s. The following monthly chart from goldchartsrus.com shows that on a monthly closing basis the ratio has just made a new multi-decade high and is now within 10% of a 300-year high, meaning that silver has almost never been cheaper relative to gold than it is today.

longtermAUAGr1700log

One way to interpret the gold/silver ratio chart is that silver has huge upside potential relative to gold. I think this interpretation is correct, but there is a realistic chance that the ratio will make a new multi-century high (in effect, a new all-time high) before silver embarks on a major upward trend relative to gold.

This is not my preferred scenario, but a new all-time high in the gold/silver ratio could occur within the next 12 months due to a major deflation scare.

My current expectation is that over the bulk of this year there will be US dollar weakness and signs of increasing “inflation”, which is a financial/economic landscape that would favour silver over gold and pave the way for some mean reversion in the gold/silver ratio. However, if the stock market bubble were to burst, economic confidence probably would tank and there would be a panic towards ‘liquidity’. For the general public that would involve building-up cash, but for many large investors it would involve buying Treasury bonds and gold. Silver eventually would benefit from the strength in the gold market, but the silver market is not big enough and liquid enough to accommodate investors who are in a hurry to find a safe home for billions of dollars of wealth. Initially, therefore, the gold/silver ratio could rise sharply under such a scenario.

The scenario described above would lead to panic at the Fed, eventually resulting in the introduction of the most aggressive asset monetisation scheme to date. That’s the point when silver probably would commence a major catch-up move.

Print This Post Print This Post