Print This Post Print This Post

The warning shots of 2007

February 26, 2018

[This post is a slightly-modified excerpt from a recent TSI commentary]

For a market analyst there is an irresistible temptation to seek out one or more historical parallels to the current situation. The idea is that clues about what’s going to happen in the future can be found by looking at what happened following similar price action in the past. Sometimes this method works, sometimes it doesn’t.

Assuming that the decline from the January-2018 peak is a short-term correction that will run its course before the end March (my assumption since the correction’s beginning in late-January), the recent price action probably is akin to what happened in February-March of 2007. In late-February of 2007 the SPX had been grinding its way upward in relentless fashion for many months. The VIX was near an all-time low and there was no sign in the price action that anything untoward was about to happen, even though some cracks had begun to appear in the mortgage-financing and real-estate bubbles. Then, out of the blue, there was a 5% plunge in the SPX. On the following daily chart this plunge is labeled “Warning shot 1″.

After the February-March ‘hiccup’ the SPX resumed its bull market. Both the stock market and the economy were believed to be in good shape, with the problems that had emerged in the realm of sub-prime mortgage lending generally considered to be contained to that relatively-unimportant part of the economy. No less of an authority than Ben Bernanke assured us that these problems were, indeed, contained.

The upward trend continued until mid-July, at which point another ‘out of the blue’ plunge began. This time the decline lasted 5 weeks and wiped 11% off the SPX. On the following daily chart it is labeled “Warning shot 2″.

The July-August decline was taken more seriously by almost everyone, including the Fed’s senior management. It was taken seriously enough, in fact, to prompt a reversal in the Fed’s monetary policy. The Fed entered rate-cutting mode.

During the weeks following the August-2007 low there was still widespread optimism. The overall economy was supposedly still strong, the Fed was being supportive and, as everyone knows, you should never fight the Fed.

The SPX went on to make a marginal new high in October-2007 and then commenced a bear market that over the ensuing 17 months would result in a loss of almost 60%.
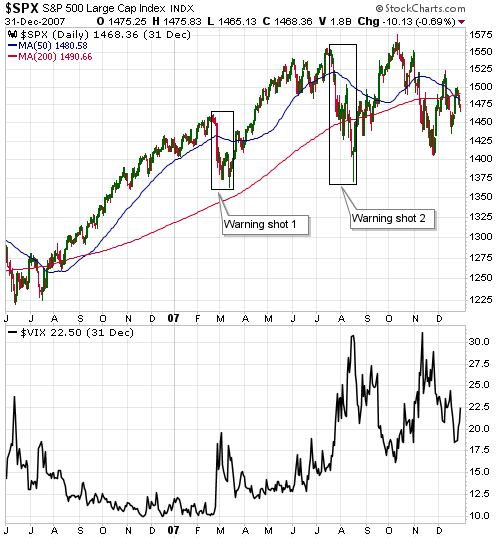
The SPX was more stretched to the upside in January of 2018 than it was in February of 2007 and the more recent plunge was twice as big, but we could be dealing with Warning Shot 1. Also, this time around there may not be a second warning shot.

Print This Post Print This Post

Gold Leads Silver

February 20, 2018

It is widely believed that silver leads gold during bull markets for these metals. I wonder how this belief first arose and persists to this day given that it is contrary to the historical record.

It is partially true that silver outperforms gold during precious-metals bull markets. In particular, it’s true that silver tends to achieve a greater percentage gain than gold from bull-market start to bull-market end. It’s also the case that silver tends to do better during the final year of a cyclical bull market and during the late stages of the intermediate-term rallies that happen within cyclical bull markets. However, the early stages of gold-silver bull markets are characterised by relative strength in gold.

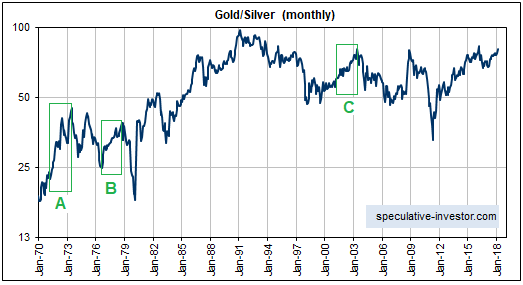
Gold’s leadership in the early stages of bull markets is evidenced by the following long-term chart of the gold/silver ratio. The boxes labeled A, B and C on this chart indicate the first two years of the cyclical precious-metals bull markets of 1971-1974, 1976-1980 and 2001-2011, respectively. Clearly, gold handily outperformed silver during the first two years of each of the last three cyclical precious-metals bull markets that occurred within secular bull markets.

gold_silver_200218

Now, in the same way that all poodles are dogs but not all dogs are poodles, the fact that gold tends to strengthen relative to silver in the early years of a precious-metals bull market doesn’t mean that substantial strength in gold relative to silver is indicative of a precious-metals bull market in its early years. For example, there was relentless strength in gold relative to silver from mid-1983 until early-1991 that took the gold/silver ratio as high as 100, but there was no precious-metals bull market during this period.

Between mid-1983 and early-1991 there was, however, a multi-year period when gold, silver, most other metals and mining stocks offered very profitable trading opportunities on the long side. I’m referring to 1985-1987. We are probably in a similar period today, with the next buying opportunity likely to arrive before the end of this quarter.

Print This Post Print This Post

For gold and bitcoin, the cost of mining follows the price

February 14, 2018

The amount of gold mined in a year is only about 1.5% of the total existing stock of gold, which is why changes in gold production have almost no effect on the gold price. It is also why changes in the cost of mining gold do not affect the gold price. In fact, cause and effect works the other way around — the change in the market price of gold determines, with a lag, the average cost of mining gold. To put it another way, the cost of mining gold follows the price of gold.

What happens is that as the gold price rises, mineral deposits or parts of deposits that were previously uneconomic become economic and start being mined. The mining of this lower-grade/higher-cost gold pushes up the average cost of production. And as the gold price falls, lower-grade/higher-cost gold is left in the ground and the average cost of production moves downward. Of course, there are substantial time-lags involved, because it takes years to bring a new mine into production and because mine plans won’t be changed in response to a price trend until the trend has been in progress for long enough to appear sustainable.

Adding to the tendency for the mining cost to follow the price is that after the price has been trending upward for a long period there will be less focus on cost control and more focus on growth, with the opposite being the case after the price has been trending downward for a long period.

Perhaps not surprisingly given that the Bitcoin system was designed to mimic gold in some respects, the relationship between the bitcoin mining cost and the bitcoin price is the same as the relationship between the cost of mining gold and the gold price. That is, the average cost of mining a bitcoin moves up and down with the price. That’s why, several years ago, it was profitable to mine bitcoins when the price was less than $1 and why the average cost of mining a bitcoin has since risen to around US$5,000.

One difference between gold and bitcoin is that the bitcoin mining industry can respond very quickly to changes in price. Whereas it probably will take at least a strong 3-year trend in the gold price to bring about a substantial change in the average cost of mining an ounce of gold, it takes almost no time to put a new bitcoin mining rig into operation and even less time to turn it off.

The way the Bitcoin distributed ledger system is designed, the computational gymnastics that have to be performed to add new blocks to the ‘chain’ and create new bitcoins scale up and down based on the total amount of computing power dedicated to the task. And the amount of computing power dedicated to the task will be dictated by the price. That is, the lower the price the smaller will be the total amount of resource (computing power and electricity) channeled into obtaining the reward of a new bitcoin, thus reducing the difficulty of performing the computations that verify transactions and the associated mining cost.

Therefore, if the price of a bitcoin falls from its current level of around $8,500 to only $100, mining bitcoins will remain a profitable business. It’s just that the quantity of resources being consumed/wasted by the mining process will be a small fraction of what it is today. Alternatively, if the price of a bitcoin skyrockets to $100,000 then the cost of mining bitcoin will also skyrocket, meaning that the quantity of resources being consumed by a process that adds nothing to the general standard of living will be vastly greater than it is today.

Returning to gold, a popular argument is that gold is an inefficient form of money due to the high cost of adding a new ounce to the existing stockpile. However, the relatively high cost of mining an ounce of gold is incurred regardless of whether or not gold is money; it is incurred because humans want to own gold and value it highly.

To further explain, well before gold was used as money, people liked to have it in their possession because of its physical characteristics: its look, feel, weight, malleability and extraordinary resistance to deterioration. In fact, it was the widespread desire to own gold that led to gold becoming money. And now that gold is no longer money (due to government command, not market preference), billions of people still desire it enough to cause the price and the mining cost to be relatively high. Allowing gold to be money again would therefore impose no additional cost.

Bitcoin is obviously different, in that its high price and associated high production cost are due solely to the possibility that it will, at some future time, be widely used as a medium of exchange. I think that the probability of this possibility is close to zero and therefore that the price of a bitcoin will eventually drop to near zero, but at the same time I think that the blockchain idea is brilliant.

Print This Post Print This Post