[This blog post is an excerpt from a commentary published at TSI last week]
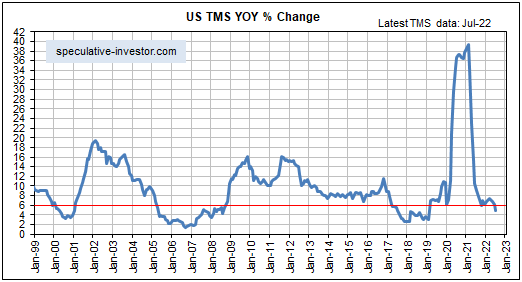
We have referred to the 6% level for the year-over-year US True Money Supply (TMS) growth rate (the US monetary inflation rate) as the boom-bust threshold, because transitions from economic boom to economic bust generally don’t begin until after the TMS growth rate has made a sustained move below this level. It was different this time, however, because according to other indicators the US economy entered the bust phase of the monetary-inflation-driven boom-bust cycle during the first quarter of this year with the TMS growth rate still above 6%. Why was it different this time and what’s the current situation?
We outlined the most likely reasons why it was different this time in previous commentaries, most recently in the 27th July Interim Update. Here’s the relevant excerpt from our 27th July commentary:
“We think that the current bust began at a higher rate of monetary inflation than in the past for two main reasons. The first is that the Fed was still in monetary-loosening mode at the peak of the economic boom. This had never happened before and resulted in even greater wastage of real savings/resources than in previous booms. The second reason is that due to decades of increasing central bank manipulation of money and interest rates, the economy has become structurally weaker and therefore the collapse of a boom now requires less relative monetary tightening than in the past.”
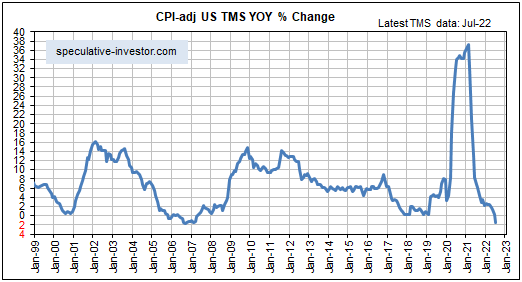
The main new point we want to make today is that the US money-supply data for July-2022, which were published on Tuesday of this week, reveal that the monetary inflation rate has now confirmed the bust by moving well below the 6% boom-bust threshold. This is illustrated by the first of the two monthly charts displayed below. Furthermore, the second of the following charts shows that the year-over-year TMS growth rate minus the year-over-year percentage change in the Median CPI*, an indicator of the real (inflation-adjusted) change in the US monetary inflation rate, has plunged to near a multi-decade low.


As an aside, from the end of last year to the end of July this year the US True Money Supply increased by $580B. This figure comprises the change in currency in circulation, the change in commercial bank demand and savings deposits, and the change in the amount of money held by the US government in the Treasury General Account (TGA) at the Fed. It is very roughly equal to the increase in commercial bank credit plus the increase in Federal Reserve credit minus the increase in the Fed’s Reverse Repo program. Over the aforementioned period the Fed’s direct actions REDUCED the US money supply by about $210B, but the Fed’s actions were more than offset by the money-creating actions of the commercial banking industry.
With the Fed still on the tightening path, it’s unlikely that the lines on the above charts have bottomed. One implication is that the yield curve probably will become more inverted over the next few months. Another implication is that it would be difficult to be too bearish with regard to the US stock market’s 6-12 month prospects.
*A price index calculated by the Cleveland Fed
 Print This Post
