Print This Post Print This Post

Why gold stocks underperform gold bullion

November 28, 2023

[This is a modified excerpt from a recent commentary at speculative-investor.com]

Gold bullion could be viewed as insurance or a portfolio hedge or a long-term investment or a long-term store of value, but a gold mining stock is none of these.

Gold mining stocks always should be viewed as either short-term or intermediate-term trades/speculations. During gold bull markets, you scale into them when they are oversold or consolidating and you scale out of them when they are overbought. The scaling in/out process obviates the need for accurate short-term timing, which is important because, as anyone who has followed the sector for many years will know, gold mining stocks tend to go down a lot more and up a lot more than initially expected.

We include the following chart in a TSI commentary about once per year to remind our readers why gold mining stocks always should be viewed as trades. The chart shows more than 100 years of history of gold mining stocks relative to gold bullion, with gold mining stocks represented by the Barrons Gold Mining Index (BGMI) prior to 1995 and the HUI thereafter. The overarching message here is that gold mining stocks have been trending downward relative to gold bullion since 1968, that is, for 55 years and counting.
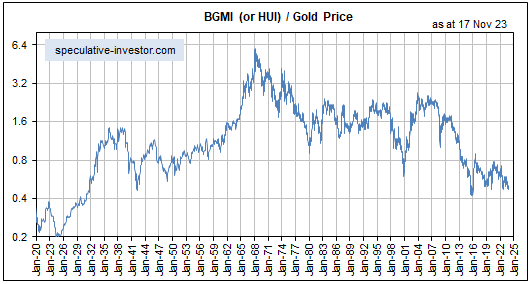
We’ve explained in the past that the multi-generational downward trend in the gold mining sector relative to gold is a function of the current monetary system and therefore almost certainly will continue for as long as the current monetary system remains in place. The crux of the matter is that as well as resulting in more mal-investment within the broad economy than the pre-1971 monetary system, the current monetary system results in more mal-investment within the gold mining sector.

Mal-investment in the gold mining sector involves ill-conceived acquisitions, mine expansions and new mine developments that turn out to be unprofitable, building mines in places where the political risk is high, and gearing-up the balance-sheet when times are good. It leads to the destruction of wealth over the long term. Physical gold obviously isn’t subject to value loss from mal-investment, hence the long-term downward trend in gold mining stocks relative to gold bullion.

The difference between the gold mining sector and most other parts of the economy is that the biggest booms in the gold mining sector (the periods when the bulk of the mal-investment occurs) generally coincide with busts in the broad economy, while the biggest busts in the gold mining sector (the periods when the ‘mal-investment chickens come home to roost’) generally coincide with booms in the broad economy. The developed world, including the US and much of Europe, currently is in the bust phase of the economic cycle, meaning that we are into a multi-year period when a boom is likely in the gold mining sector.

Print This Post Print This Post

New Recession Warnings

November 22, 2023

[This blog post is an excerpt for a commentary published at speculative-investor.com on 19th November 2023]

There was a government-spending-fuelled burst of economic activity in the US during the third quarter of this year that led to a high GDP growth number being reported for the quarter, but signs of weakness are now appearing in coincident economic indicators.

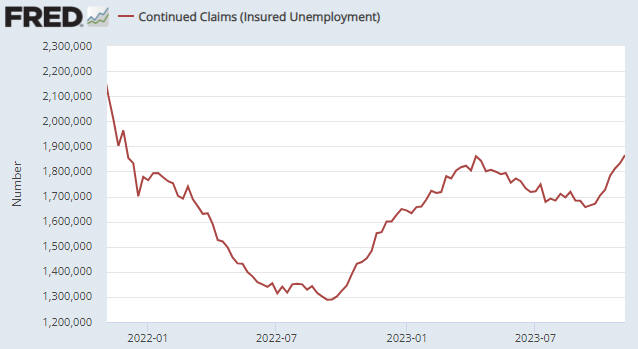
The most important of the aforementioned signs is the rise in Continuous Claims for Unemployment Insurance. With reference to the following weekly chart, Continuous Claims bottomed in September-2022, moved higher into April of this year, dropped back to a higher low during September and has just confirmed an upward trend by moving above its April-2023 high. This is consistent with our view that a US recession will begin before the end of this year, although based on the historical record the recession start date won’t become official until the second half of next year.

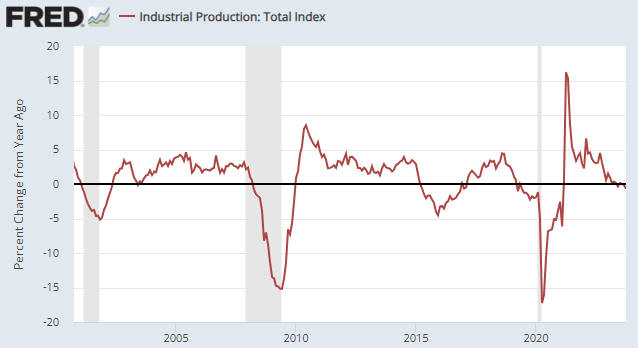
Another sign is the decline in the year-over-year (YOY) growth rate of Industrial Production (IP) to negative 0.70%, the lowest level since February-2021. The YOY growth rate of IP in October-2023 is similar to where it was in the month before the start of the 2001 recession and is well below where it was at the start of the 2007-2009 recession. Below is a chart of this coincident economic indicator.

It probably will be many months before the US coincident economic data become consistently weak. In the meantime, we expect to see — and should see, if our current outlook is correct — a gradual increase in the proportion of economic statistics that are worse than generally expected. We also expect to see a gradual shift away from the “soft landing” narrative (the belief that the US economy will make it through the monetary tightening without a recession) towards the recession narrative.

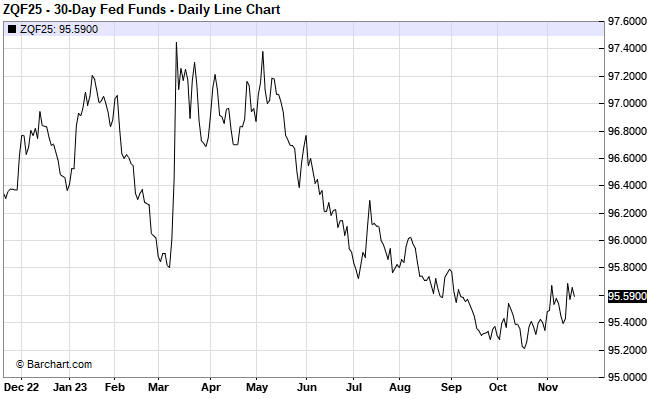
A few weeks ago (refer to the 30th October Weekly Update) we noted early signs that the financial world was starting to move away from the soft landing scenario. One of the indicators that we are tracking to check that this shift remains in progress is the January-2025 Fed Funds Futures (FFF) contract, a daily chart of which is displayed below. Note that the line on this chart moves in the opposite direction to interest rate expectations.

The substantial downward move on this chart from early-May through to mid-October reflects a major increase in the popularity of the soft landing scenario, while the relatively small upward move over the past few weeks is tentative evidence that a shift towards general belief in a less innocuous economic outcome has begun.

At this time, the soft landing narrative remains dominant. That’s why the SPX has rebounded to within 2% of its high for the year and the January-2025 FFF contract has retraced only a small part of its May-October decline. However, we expect that belief in a soft landing will dissipate over the next six months, leading to a substantial decline in the stock market and a substantial rise in the US$ gold price.

Print This Post Print This Post

Why junior gold mining stocks have performed so poorly

November 16, 2023

[This blog post is a brief excerpt from a recent commentary published at speculative-investor.com]

Why has the junior end of the gold mining world performed so poorly over the past two years. In particular, why has it performed so poorly over the past 12 months in parallel with a relatively strong gold market?

Understanding why begins with understanding that in the absence of a mining operation that can be used to PROFITABLY extract it from the ground, gold in the ground has option value only. The option could be valued by the market at almost zero or a lot depending on many factors, the most important variable being the public’s desire to speculate. Furthermore, a gold mining operation that generates losses year after year also has option value only, with the public’s desire to speculate again being the most important determinant of the option’s market value.

In other words, with the relatively illiquid stocks it comes down to the general public’s desire to speculate.

Hedge funds usually will focus on gold mining ETFs or the larger-cap gold stocks because they need the liquidity. Wealthy professional investors such as Eric Sprott typically will take positions via private placements with the aim of eventually exiting via a liquidity event such as a takeover. It’s the general public that determines performance at the bottom of the food chain and over the past two years the public has become progressively less interested in speculating. Hence, the market values of stocks with option value only have become a lot cheaper.

Although during the course of this year we have suggested directing most new buying in the gold sector towards profitable producers, we are still interested in gold stocks that have option value only. These are the stocks that will generate by far the largest returns after the general public starts getting interested in the sector. However, sparking that interest probably will require a minimum of all-time highs in the US$ gold price and gold mining indices such as the HUI breaking above their H1-2023 highs, which probably won’t happen until the first half of next year. In fact, based on the historical record, sparking the general public’s interest in speculative gold mining stocks could require the broad stock market to begin discounting the combination of a recovery from recession and much easier monetary conditions, which possibly won’t happen until the first half of 2025.

Until then, most (not all) new buying in the gold sector should be directed towards profitable producers, that is, towards the stocks of real businesses. But, only when they are oversold or consolidating. Don’t get excited and buy them after they have just gone up a lot.

Print This Post Print This Post

Peak “Soft Landing”?

November 3, 2023

[This blog post is an excerpt from a commentary published at speculative-investor.com on 29th October 2023]

Thanks largely to rapid government spending, inventory building by the private sector and about $500B coming out of the Fed’s Reverse Repo (RRP) Facility, US ‘real’ GDP grew at an annualised rate of almost 5% in Q3-2023. The GDP number included strong quarterly growth in Real Gross Private Domestic Investment (RGPDI), which could be explained in part by investment incentivised by the Federal government’s misnamed “Inflation Reduction Act”. What are the implications for the financial markets of this economic activity surge?

With one important exception, all of the implications are in the past. It has been known for a few months that the GDP growth number for Q3 would be high, meaning that a high number was factored into market prices well before last week’s news. To the financial markets, what matters now is what’s likely to happen to economic activity over the quarters ahead.

We suspect that the GDP growth number that gets reported for the final quarter of this year will look fine, partly because money is coming out of the RRP Facility at a rapid rate (about $450B came out over just the past four weeks) and partly because the US federal government will continue spending as if there were no tomorrow. However, it’s likely that much weaker numbers will be reported during the first half of 2024 due to the lagged effects of monetary tightening, the exhaustion of the RRP liquidity channel, the effects on the US economy of recession in Europe, and reduced consumer spending in response to declining asset prices (stocks and real estate).

The one important exception mentioned above is the potential effect of the just-reported high GDP growth number on the future actions of the Fed. In particular, even if it is likely that the rate of GDP growth will be significantly lower in Q4-2023 and turn negative during H1-2024, the Fed tends to look backward and therefore could be encouraged by last quarter’s strong growth to stay tighter for longer.

It turned out, however, that during the hours following last Thursday’s announcement of the strong GDP growth number the expectations of the Fed Funds Futures (FFF) market shifted in a ‘dovish’ direction. Specifically, according to this market, last Thursday the probability of another Fed rate hike before year-end dropped from around 29% to around 20% and the expected Fed Funds Rate at the end of next year fell from 4.68% to 4.60%.

The market responses to last week’s strong US GDP number and generally good news on the corporate earnings front could be early signs that the financial world is beginning to move away from the “soft landing” scenario (the idea that the US economy will avoid a recession). This is to be expected, in that every recession begins as a soft landing and then turns into something more painful. The timing is usually difficult to pin down, though, because on the way to a recession there invariably are many twists and turns.

Print This Post Print This Post