Print This Post Print This Post

The stock market’s “true fundamentals”

July 29, 2019

Below is an excerpt from a recent TSI commentary.

An investment’s true fundamentals exert pressure on its price. It is not unusual for the price to trend in the opposite direction to the fundamentals for a while, but if fundamentals-related pressure consistently acts in one direction then the price should eventually fall into line by trending in that direction. Our “true fundamentals” models for gold, the US stock market, the Dollar Index and commodities (the GSCI Commodity Index) are attempts to quantify the magnitude and direction of fundamentals-related pressure.

We have a lot of confidence in our Gold True Fundamentals Model (GTFM), because we understand why it should work and we know that it has worked well over a long enough period to rule out luck/randomness. It isn’t a short-term timing indicator, but all intermediate-term trends in the US$ gold price over the past 17 years* have been in line with the fundamentals as reflected by the GTFM. However, we have less confidence in our other true fundamentals models.

We recently have given more thought to the construction of our Equity True Fundamentals Model (ETFM), which is designed to indicate the direction and magnitude of fundamentals-related pressure on the US stock market (as represented by the S&P500 Index).

The version of the ETFM that we have been using takes into account credit spreads, the yield curve, the real interest rate (as indicated by the 10-year TIPS yield), the relative strength of the banking sector and the G2 monetary inflation rate, with the monetary inflation rate given a greater weighting than the other inputs. However, we now think it was a mistake to put extra emphasis on monetary inflation. This is because although the rate of change in the money supply is the most important long-term driver of the stock market, the time between a trend change in monetary inflation and the effects of this trend change becoming evident in the stock market is long and variable.

In an effort to make the ETFM more useful over the intermediate-term (6-18 month) periods that are of primary interest to us we have made two changes to the Model’s construction. First, we have reduced the emphasis on monetary inflation so that it has the same weighting as the Model’s other inputs. Second, the ISM New Orders Index (NOI) has been added as an input to the Model. This input will be set to 1 when the NOI is 55 or above and set to 0 when the NOI is below 55. This is being done because a) the stock market tends to perform much better when the NOI is greater than 55 than when the NOI is less than 55, and b) there is a strong tendency for the NOI to fall below 55 PRIOR to periods of significant stock market weakness, meaning that weakness in the NOI is not simply a reaction to weakness in the stock market.

The above changes didn’t make a big difference to the historical performance of the ETFM, but they did make the Model a little more sensitive to shifts in the fundamental winds. This is a plus, because the original model wasn’t sensitive enough. Note, as well, that these changes did not alter the current signal. Both the original ETFM and the new/improved ETFM switched from neutral to bearish on 19th April 2019.

Here is a chart comparing the new ETFM (the blue line) with the SPX since the start of 2002. Stock market fundamentals are considered to be bearish when the ETFM is below 50, neutral when the ETFM equals 50 and bullish when the ETFM is above 50.
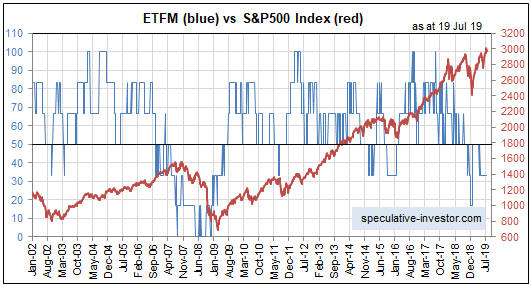
The true fundamentals are equity-bearish at the moment. If they remain bearish then the price eventually WILL fall into line. Furthermore, the longer the price trends upward or stays elevated in parallel with a bearish fundamental backdrop, the faster the eventual downward price move is likely to be.

*For some of the GTFM inputs we don’t have data prior to the early-2000s, so we can’t compare the GTFM and the gold price during earlier periods.

Print This Post Print This Post

Interest rates and the stock market

July 23, 2019

There is no simple relationship between interest rates and the stock market. In particular, a lower interest rate doesn’t necessarily lead to a higher stock market and a higher interest rate doesn’t necessarily lead to a lower stock market.

The conventional wisdom on this topic is based largely on what happened over the past few decades. Clearly, US equities generally fared well after interest rates embarked on a long-term downward trend in the early 1980s and generally fared poorly when interest rates were in a rising trend during the 10-14 year period prior to the early 1980s. Also, the inverse relationship (a lower interest rate leads to a higher stock market and a higher interest rate leads to a lower stock market) seemed to make sense and was incorporated into a popular stock market valuation tool called “The Fed Model”.

The Fed Model compares the earnings yield of the S&P500 Index (the reciprocal of the S&P500′s P/E ratio, expressed as a percentage) with the 10-year T-Note yield to determine if the stock market is over-valued or under-valued. The higher the S&P500 yield relative to the 10-year T-Note yield, the better the value supposedly offered by the stock market. An implication is that if the 10-year yield is very low, the S&P500 can have a very high P/E ratio and still not be over-valued. For example, according to the Fed Model the S&P500 is attractively valued today. This is because even though the current P/E ratio is almost as high as it ever gets (excluding the 1999-2000 bubble period), the current earnings yield is well above the current 10-year T-Note yield.

However, the simple relationship between interest rates and the stock market only makes sense at a superficial level. It doesn’t hold up under deeper analysis. The reason is that the current value of a company is the sum of all of that company’s future cash flows discounted at some rate, and in most cases it will not be appropriate to use today’s interest rate to discount cash flows that won’t happen until many years or even decades into the future.

When picking a rate at which to discount distant cash flows it would be more reasonable to use a long-term average interest rate than to use the current interest rate. Furthermore, there is no good reason why the change in the interest rate over the next 12 months should significantly affect the interest rate used to discount cash flows that are expected to occur 10-20 years into the future.

But if it is wrong to assume that the stock market should trend inversely to the interest rate over long periods, then why did this assumption prove to be correct over the bulk of the past 50 years?

The first part of the answer is that over the very long term the stock market swings from under-valued to over-valued and back again and that in the early 1980s a bond market under-valuation extreme happened to coincide with a stock market under-valuation extreme. The second part of the answer is that financial market history goes back much further than 50 years and the simple relationship on which the Fed Model is based is not apparent prior to 1970. In essence, the theory that a lower interest rate leads to a higher stock market and a higher interest rate leads to a lower stock market is an artifact of the past 50 years.

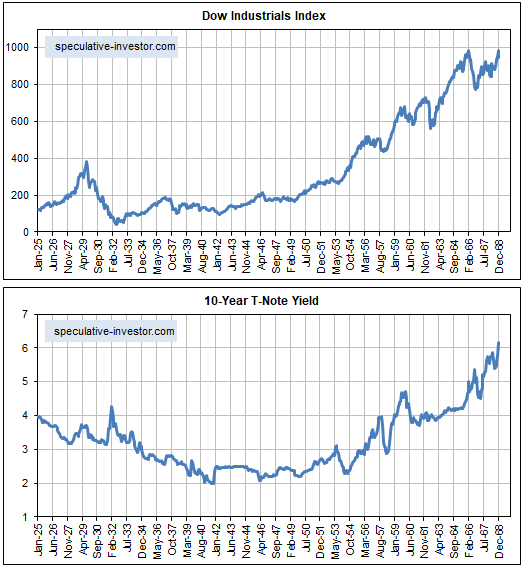
The above statement is supported by the following charts. The charts show the Dow Industrials Index and the 10-year T-Note yield from the beginning of 1925 through to the end of 1968.

The US stock market (as represented by the Dow Industrials in this case) was in a secular bearish trend from 1929 until 1942. Apart from an upward spike due to fear of government default in 1931, the 10-year yield was in a downward trend during this bearish stock market period. The stock market then embarked on a secular bullish trend that didn’t end until the late-1960s. The 10-year yield was in an upward trend during this bullish stock market period. That is, the long-term relationship between interest rates and the stock market during 1929-1968 was the opposite of what it was over the past 50 years.

DJIA_10YTNote_170719

Print This Post Print This Post

The coming T-Bond decline

July 16, 2019

A large divergence between two fundamentally-correlated market prices is important because such a divergence usually will be closed via a big move in one or both prices. However, divergences sometimes build for an inconveniently long time before they start to matter.

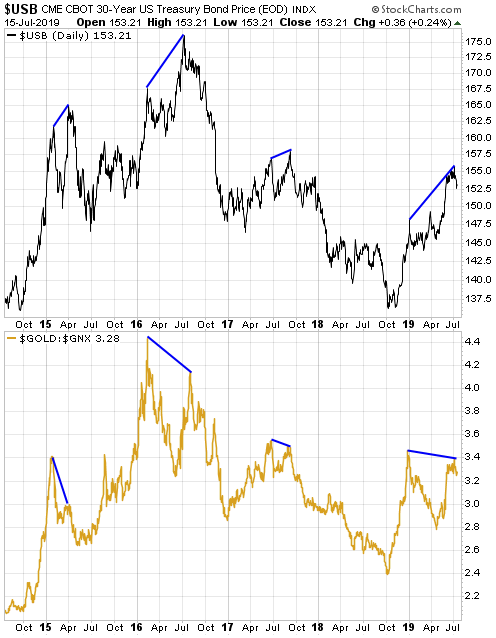
The gold/commodity ratio (the US$ gold price divided by the GSCI Spot Commodity Index) and the T-Bond are strongly correlated over the long term. They also tend to be well correlated over shorter timeframes, but significant short-term divergences sometimes occur. One such divergence has been developing since the beginning of this year, with the T-Bond making a sequence of higher highs while the gold/commodity ratio stays below its late-December high. Note that even the recent surge to a new 5-year high by the US$ gold price was not enough to push the gold/GNX ratio above its late-December high.

The current divergence and previous similar divergences (higher highs for the T-Bond in parallel with lower highs for the gold/commodity ratio) are illustrated by the following chart. The previous similar divergences led to large declines in the T-Bond price and I can think of no reason to expect that it will be different this time.

USB_goldGNX_150719

Print This Post Print This Post

Gold and Inflation Expectations

July 8, 2019

[This post is an excerpt from a recent TSI commentary]

Gold tends to perform well relative to commodities in general when inflation expectations are FALLING. The evidence is presented below in chart form.

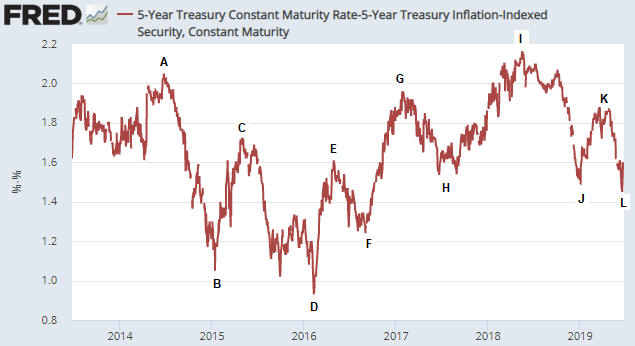
The first of the following charts shows the Expected CPI, which in this case is determined by subtracting the yield on the 5-year TIPS (Treasury Inflation Protected Security) from the yield on the 5-year T-Note. In effect, the chart shows the average annual “inflation” rate that the market expects the US government to report over the next 5 years. We’ve labeled all of the important highs and lows on this chart.

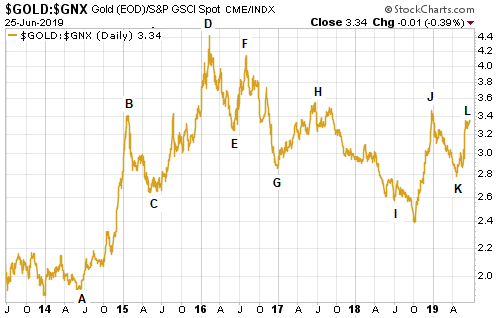
The second of the following charts shows the gold/commodity ratio (the US$ gold price divided by the GSCI Spot Commodity Index). The labels on this chart correspond to the labels on the first chart. For example, point A on the first chart is the same time as point A on the second chart.

Notice that in every case over the 6-year period covered by the following charts, a high for inflation expectations (the Expected CPI) is associated with a low for the gold/commodity ratio and a low for inflation expectations is associated with a high for the gold/commodity ratio.

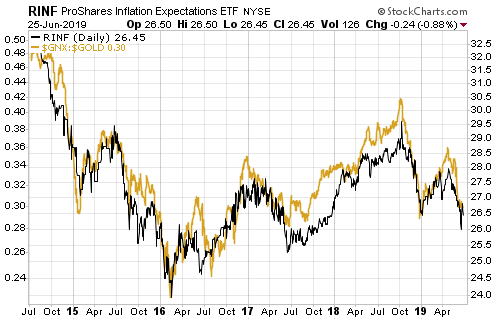
The relationship we tried to show above is more clearly demonstrated by the next chart. On this chart the commodity/gold ratio (as opposed to the gold/commodity ratio) is compared to the ProShares Inflation Expectations ETF (RINF). The correlation clearly is strong, with commodities consistently outperforming gold when inflation expectations are rising and underperforming gold when inflation expectations are falling.

An implication of the above charts is that if inflation expectations are close to an intermediate-term bottom then the financial world is close to the start of a 6-12 month period during which the industrial metals perform better than gold. Alternatively, a further decline in inflation expectations (increasing fear of deflation) would lead to additional relative strength in gold.

We realise that the above message is the opposite of what most people believe about gold, but a lot of what most people believe about gold is not accurate. Of particular relevance to this discussion, gold has never been a hedge against “price inflation”.

Gold tends to perform relatively well during periods when financial-system and/or economic confidence is on the decline. The declining confidence sometimes will go hand-in-hand with rapid “price inflation”, but it isn’t reasonable to expect gold to be a useful hedge against what generally is considered these days to be normal “inflation”. In fact, part of the reason for the strong INVERSE relationship between the gold/commodity ratio and inflation expectations is the general view that “inflation” of 2%-3% is beneficial.

Our view is that the next three months could be dicey, especially if there’s another sharp decline in the stock market. However, we think that by the end of this year inflation expectations will be significantly higher and industrial metals such as copper and platinum will be significantly more expensive relative to gold.

Print This Post Print This Post