Print This Post Print This Post

The global US$ short position

June 30, 2020

[This blog post is a modified excerpt from a recent TSI commentary]

Financial market discussions and analyses often focus on fundamental issues that don’t matter, or at least don’t provide useful clues regarding the likely future performance of the market in question. A good example is the so-called “global US$ short position”, which is regularly cited in support of a bullish outlook for the US$.

The argument is that the roughly $12 trillion of US$-denominated debt outside the US constitutes a short position that will create massive demand for dollars and thus put irresistible upward pressure on the Dollar Index (DX). There is an element of truth to the argument, but the “global US$ short position” always exists. It exists during US$ bull markets and it exists during US$ bear markets, because it is simply an effect of the US$ being the currency of choice for the majority of international transactions. Furthermore, the shaded area on the following chart shows that the quantity of dollar-denominated debt outside the US steadily increases over time and that even the 2008-2009 Global Financial Crisis resulted in only a minor interruption to the long-term trend. Consequently, the existence of this debt isn’t a major intermediate-term or long-term driver of the US dollar’s exchange rate.


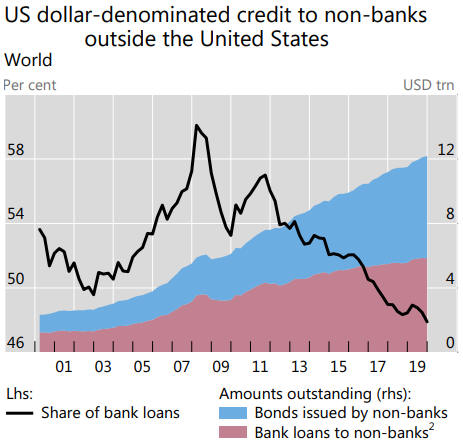
Source: https://www.bis.org/statistics/gli2004.pdf

The element of truth to the “global US$ short position” argument is that a significant strengthening of the US currency relative to the currencies of other countries will increase the cost of servicing dollar-denominated debt in those countries. This lessens the ability to borrow additional US dollars and puts pressure on existing borrowers to reduce their US$ obligations. In effect, it leads to some short covering that magnifies the upward trend in the US dollar’s exchange rate. This means that while the “global US$ short position” won’t be the cause of a strengthening trend in the US$, it can exacerbate such a trend.

We mentioned above that there is no empirical evidence that the “global US$ short position” drives trends in the US dollar’s exchange rate, but that doesn’t guarantee that the pile of US$-denominated debt outside the US won’t become an important exchange-rate driver in the future. The reason it won’t become important in the future is that prices are driven by CHANGES in supply and demand. The US$12T+ of foreign dollar-denominated debt represents part of the existing demand for dollars, meaning that the demand-related effects of this debt on the dollar’s exchange rate are ‘in’ the market already. At the same time, the total supply of dollars is growing rapidly.

At this point it’s worth addressing the idea that the Fed would be powerless to stop the US$ from appreciating if a major ‘debt deflation’ got underway. This is nonsense. Until the law of supply and demand is repealed, someone with the unlimited ability to increase the supply of something WILL have the power to reduce the price of that thing.

The Fed’s power to reduce the relative value of the US dollar was very much on display over the past few months. The financial-market panic and economic collapse of March-2020 predictably resulted in a desperate scramble for US dollars, leading to a fast rise in the Dollar Index. However, it took the Fed only two weeks to overwhelm the surging demand for dollars with a deluge of new dollar supply.

The upshot is that the so-called global US$ short position is not a valid reason to be a US$ bull.

With regard to performance over intermediate-term (3-18 month) time periods, the fundamentals that matter for the US$ are relative equity-market strength and interest rate differentials. This combination of drivers has been neutral for more than a year but soon could turn bearish for the US$.

Print This Post Print This Post

The coming “price inflation”

June 17, 2020

[This blog post is an excerpt from a recent TSI commentary]

The year-over-year rate of growth in US True Money Supply (TMS), a.k.a. the US monetary inflation rate, has continued its journey “to da moon.” Based on the monthly monetary data for May-2020, it is now at 27% and still rising rapidly. The following chart shows that the money-supply growth surge engineered by “Mississippi Jay” Powell* now dwarfs the earlier efforts of “Easy Al” Greenspan and “Helicopter Ben” Bernanke.

Anyone who thinks that this year’s monetary inflation moon-shot won’t lead to much higher prices for many things is kidding themselves. It has already fuelled the fastest 40% rise in the S&P500 Index in history, but unlike the other money-supply growth surges of the past 20 years the current episode also should lead to substantial gains in what most people think of as “inflation”. Not so much this year, because in the short-term there are counter-balancing forces such as an increasing desire to hold cash, but during 2021-2022.

Apart from its larger scale, there are three reasons that the money-supply growth surge engineered by “Mississippi Jay” should lead to much higher “price inflation”** than the money-supply growth surges engineered by his predecessors. The first is that although the Fed is still buying US government debt via Primary Dealers as opposed to directly from the government, it is crystal clear that the Fed is monetising the US government’s deficit. That’s why the Federal government is no longer even pretending to be concerned about the level of its spending and indebtedness. In effect, MMT (Modern Monetary Theory) is now being implemented in the US.

MMT is based on the ridiculous idea that there should be no upper limit on government spending/borrowing, facilitated via the creation of new money, as long as the CPI’s growth rate is below a certain level. It completely ignores all effects of monetary inflation apart from the most superficial. It also ignores the reality that government spending tends to be counterproductive because it is driven by political considerations and not market forces.

The good thing about MMT is that it should short-circuit the boom-bust cycle, in effect almost skipping the boom and going directly to an inflationary bust. This is because it lays bare the crudeness of the central bank’s monetary machinations. No longer is the central bank (incorrectly) perceived as finely tuning interest rates to keep the economy on an even keel. Under MMT it is seen to be pumping out whatever amount of new money the government demands.

The boom associated with this year’s monetary inflation moon-shot began in April and probably will end within the next six months. Actually, it might have ended already.

The second reason to think that this year’s money-supply growth surge will be followed by substantial “price inflation” is that the lockdowns of the past few months have damaged supply chains. This, combined with the shift away from globalisation, will lead to reduced supply and/or less efficient production of goods.

The third reason is supply constraints on important commodities. Firstly, this year’s lockdowns caused the mining industry to delay expansion plans and cancel new developments. Secondly, in labour-intensive mining countries such as South Africa, the requirement to implement social distancing following the return to work has made and will continue to make the mines less efficient. Thirdly, many small-scale commodity producers that together account for a significant portion of total supply have been put out of business by the lockdowns. Fourthly, the “El Nino” weather event of 2020-2021 and the Grand Solar Minimum that should start becoming influential in 2021-2022 probably will result in extreme weather volatility, which potentially will disrupt the supply of important agricultural commodities during 2021-2022. Lastly, due to the virus-related lockdowns and associated economic pressures there is heightened risk of war in the Middle East, implying heightened risk of an oil supply shock.

In summary, the latest flood of new money created by central banks will be more widely perceived to be “inflationary” than the other ‘money floods’ of the past 20 years. In addition, the latest money flood has occurred near the start of a multi-year period during which the production of many commodities and manufactured goods will be hampered. A likely result is substantial “price inflation” during 2021-2022.

*“Mississippi Jay” is the nickname we’ve given to current Fed Chair Jerome (Jay) Powell. The name links Powell with John Law, the roguish Scotsman (is there any other kind?) who, while residing in France in the early-1700s, engineered the Mississippi Bubble via a scheme that involved creating an extraordinary amount of new currency.

**We don’t like the term “price inflation”, because there is no such thing as an economy-wide average price level and because at any given time some prices will be rising while others are falling. However, we use the term because it is generally understood to mean a rising cost of living for most people.

Print This Post Print This Post

Money creation goes nuclear

June 9, 2020

[This blog post is an excerpt from a commentary published at TSI last week]

In most countries/regions, the money-supply growth rate bottomed in 2019 and by the beginning of this year was in a clear-cut upward trend. Then came the “coronacrisis”, involving widespread economic lockdowns and unprecedented central bank money/credit creation designed to counteract the effects of the lockdowns. A result was a veritable explosion in monetary inflation rates around the world during March and April (April being the latest month for which there is complete money-supply information). Here are some examples:

1) The combination of US and euro-zone money supply that we call G2 True Money Supply (TMS) was at a 10-year low in the middle of last year. It is now at an all-time high. This is by far the most bullish force currently acting on equity and commodity prices.

2) Early last year Australia was in danger of experiencing monetary deflation, but this country’s monetary inflation rate has since rocketed to an all-time high of 24%. This is not bearish for the A$ relative to other currencies and especially not relative to the US$ (we suspect that the A$ will trade at parity with the US$ within two years), because the A$’s exchange rate is influenced to a far greater extent by the commodity markets than by the local monetary inflation rate. However, it suggests that in Australia the prices of goods, services and assets will go up a lot over the next few years.

3) The Bank of Canada has been a little more circumspect than most other central banks over the past few months, but in response to the recent crisis it has done enough to boost the country’s monetary inflation rate to near a 10-year high. A year ago it was near a 20-year low.

4) We occasionally read articles that attempt to make the case that central bank money pumping does not lead to higher prices, with the situation in Japan cited as evidence. Japan supposedly is relevant because the Bank of Japan (BOJ) has been aggressively monetising assets for a long time with minimal effect on prices.

As we’ve noted many times in the past, prices have been stable in Japan because Japan’s monetary inflation rate has oscillated at a relatively low level for decades. Whatever the BOJ has been doing, it has NOT been pumping money at a rapid rate. Even now, in the face of additional monetary stimulus, the year-over-year rate of growth in Japan’s M2 money supply is below 4%. This contrasts with a US money-supply growth rate of almost 20%.

Therefore, the low rate of price inflation in Japan is in no way mysterious. It’s exactly what would be expected from an economy with a low rate of monetary inflation and some productivity growth.

In summary, outside of Japan the supply of currency is increasing at such a fast pace that there WILL be substantial price increases over the next two years. However, the price increases won’t be uniform. For example, due to a high unemployment rate the price of labour probably will be a laggard, and due to their relative supply situations the price of oil probably won’t rise by as much as the prices of uranium, natural gas, copper, nickel and zinc.

Print This Post Print This Post