Print This Post Print This Post

Boom-Bust Cycle Update

November 23, 2021

In a 9th November blog post I wrote that the US TMS (True Money Supply) growth rate had fallen far enough to suggest that the next trend reversal in credit spreads from narrowing to widening would mark the start of a boom-to-bust transition rather than just an interruption to the boom. What’s the current situation?

Before answering the above question it’s worth reiterating that a trend reversal in credit spreads (from narrowing to widening) isn’t the only early warning that a boom-to-bust transition has begun for the US economy. As mentioned in previous blog posts (for example, HERE), another necessary signal is pronounced weakness in the Industrial Metals Index (GYX) relative to the gold price. In other words, prior to the end of a boom* there will be upward trend reversals in credit spread indicators such as the US High Yield Index Option-Adjusted Spread (HYIOAS) and a downward trend reversal in the GYX/gold ratio. As an aside, the most recent bust began in early-October of 2018 and ended in early-June of 2020.

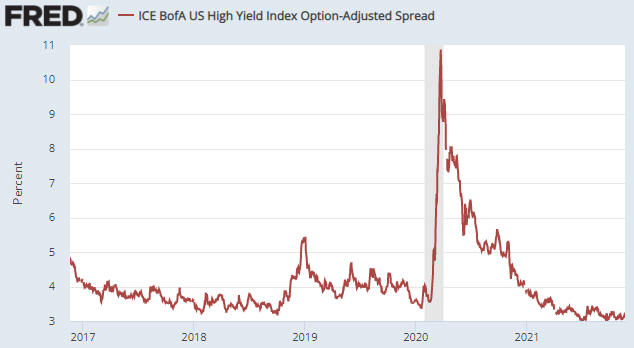
The following daily chart shows the HYIOAS.

In early-July of this year the HYIOAS was at its lowest level in more than 10 years and not far from an all-time low. It spiked upward around the middle of July and then returned to near its low, where it remains (it ended last week at around 3.2%).

Note that a credit-spread reversal would be signalled by the HYIOAS making a higher short-term high AND moving back above 4%. The first of these criteria (the initial warning) would be triggered by a move above 3.5%.

HYIOAS_231121

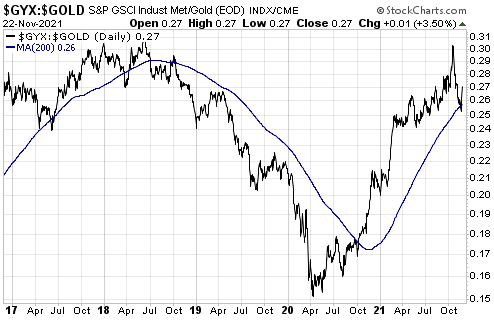
The next chart shows the GYX/gold ratio. To generate a boom-to-bust warning the line on this chart would have to make a sustained break below its 200-day moving average.

GYX_gold_231121

Neither of the indicators that in the past have always warned prior to the start of a boom-to-bust transition for the US economy has triggered, although it would not take much additional weakness in GYX relative to gold for the GYX/gold ratio to generate a warning signal. This implies that the US economic boom that began during the second quarter of 2020 is intact. Furthermore, as things currently stand it looks like the start of a boom-to-bust transition is still at least a few months away.

*An economic boom is a period of generally rapid economic activity fuelled by monetary inflation. It does not necessarily involve sustainable economic progress. In fact, most of the apparent gains achieved during the boom tend to be relinquished during the subsequent bust.

Print This Post Print This Post

Reconciling high “inflation” and low bond yields

November 16, 2021

[This blog post is a slightly modified excerpt from a TSI commentary published last week]

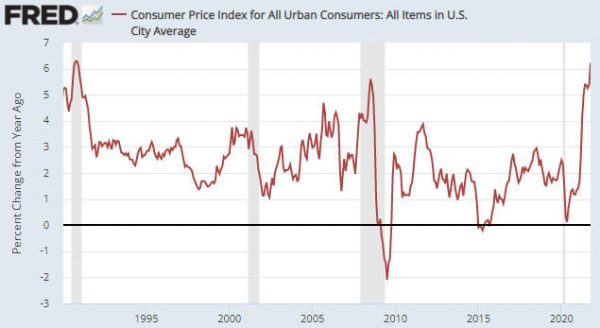
The US government just reported a 6.2% year-over-year increase in the CPI (refer to the following chart). This was the largest increase since 1990 and the second-largest increase since 1982. Furthermore, nobody in their right mind believes that the CPI overstates the pace of US$ depreciation. How can this be happening in parallel with a yield of about 1.5% on the US 10-year T-Note and a yield of about 1.9% on the US 30-year T-Bond?

There’s a two-part answer to the above question, the first part of which is that the bond market expects the CPI to average only 2.7% over the next ten years. We know this is the case because 2.7% is the annual CPI increase factored into the current price of the 10-year TIPS. In other words, the bond market is anticipating a substantial pullback in the “inflation” rate from its current level. However, even a 2.7% rate of increase in the CPI is inconsistent with a current 10-year T-Note yield of around 1.5%. Based on today’s inflation expectations, the 10-year T-Note currently should be yielding at least 3.5%.

The other part of the answer is that the financial markets expect the Fed to do whatever it takes to cap the yields on US government bonds at well below the rates that would be consistent with the official “inflation” rate.

Given its unlimited ability to purchase assets with money that it creates out of nothing, the Fed is capable of keeping government bond yields pegged at unrealistically low levels for a long time. However, doing so would have very bearish implications for the US$ and very bullish implications for most US$-denominated prices. In particular, Fed policy that involved capping US government bond yields at low levels in the face of obvious evidence of high “inflation” would be extremely bullish for the US$ gold price.

Official Fed policy that involves capping bond yields at low levels in the face of persistently high “inflation” is not likely to be introduced over the next six months, but I suspect that it will become a major driver of market prices during 2023-2024.

Print This Post Print This Post

Setting the stage for the 2022 bust

November 9, 2021

[This blog post is an excerpt from a commentary posted at speculative-investor.com about two weeks ago]

The US financial system currently has an abundance of ‘liquidity’. We know that this is the case because US credit spreads are close to multi-decade lows. The probability of a liquidity crisis or crunch with credit spreads near their narrowest levels in decades is not just low, it is zero. However, the money-supply growth trend warns that a boom-to-bust transition could begin as soon as the first half of 2022, potentially setting the stage for a major financial-market event/crisis during the second half of 2022.

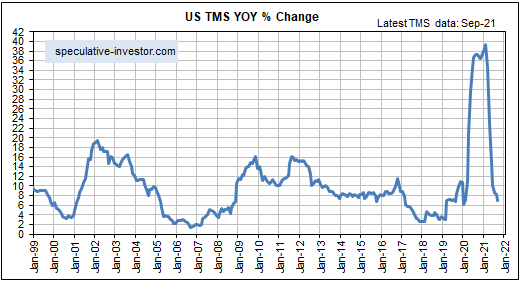
The US money-supply growth trend is illustrated by the following chart. The chart shows that the year-over-year rate of growth in US True Money Supply (TMS) peaked at almost 40% early this year and has since collapsed to around 7%.

We thought that the TMS growth rate would level out during September, but instead it extended its steep decline. The reason is that the Fed, via its Reverse Repo (RRP) program, removed $330B from the financial system over the course of the month. To put it another way, for every dollar the Fed added via its QE program during September it removed almost three dollars via its Reverse Repo program.

If not for the Fed’s additions to its RRP program in September, the TMS growth rate would have ended the month at 8.7% (slightly above the end-August level) instead of 7.0%. Furthermore, if not for all the money removed by the Fed via RRP’s since the program was initiated in March of this year, the TMS growth rate would now be 14.5% as opposed to 7.0%.

As an aside, the Fed hasn’t removed a lot of money ($1.43 trillion at the time of writing) from the US financial system over the past seven months in an effort to tighten monetary conditions; it has done so to address a problem that can be aptly described as a surplus of dollars. There has been a huge quantity of dollars ‘sloshing around’ the financial system looking for a zero-risk, temporary home with a small positive yield. The Fed’s RRP program has provided such a home.

All of the money removed by the Fed via RRP’s will be returned to the US financial system at some point (probably next year). However, the US TMS growth rate has fallen far enough to suggest that the next trend reversal in credit spreads from narrowing to widening will mark the start of a boom-to-bust transition rather than just an interruption to the boom.

By the same token, until the credit-spreads trend reversal happens it will be reasonable to assume that the boom is intact and that there won’t be anything more bearish than moderate corrections in the senior equity and commodity indices.

Print This Post Print This Post