Wright’s Law, EVs, and the stupidity of inflation targeting

October 19, 2020

[This blog post is an excerpt from a recent TSI commentary]

Moore’s Law, which is based on a comment by Intel co-founder Gordon Moore in the 1960s, states that the number of transistors on a chip doubles every two years. In effect, it states that the computer industry’s efficiency doubles every two years. Moore’s Law worked well in the semiconductor/computer industry for a few decades, but that was due to a set of circumstances that existed in that particular industry over a certain time rather than the general applicability of the ‘law’. The ‘law’ no longer works in the computer industry and can’t be applied in a useful way to technology in general. Wright’s Law, on the other hand, is more useful when it comes to explaining and predicting the effects of technology-driven improvements in efficiency. Wright’s Law pre-dates Moore’s Law by about 30 years (it was postulated by Theodore Wright in 1936) and states that for every cumulative doubling of units produced, costs will fall by a constant percentage.

The reason that Wright’s Law works better than Moore’s Law (Wright’s Law can be applied to all industries and has even been more accurate than Moore’s Law in the computer industry) is that it focuses on cost as a function of units produced rather than time. The beauty of Wright’s Law is that once an industry has been around for long enough to determine the relationship between the increase in units produced and the reduction in unit cost, accurate predictions can be made regarding what’s likely to happen over years and even decades into the future. The limitation is that a certain amount of history is required to establish the percentage reduction in cost that accompanies a certain increase in the production rate.

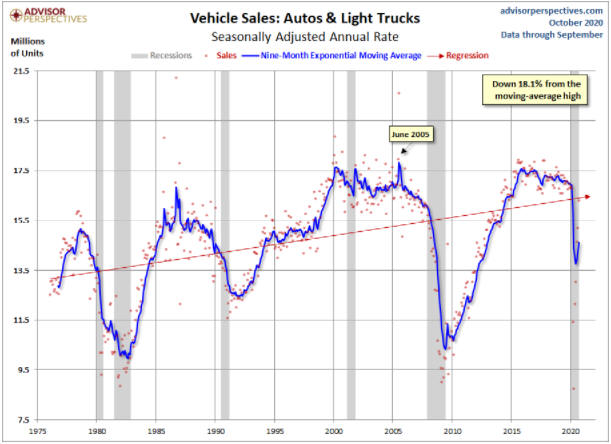
It should be possible to apply Wright’s Law to any growing industry. Of particular relevance to this discussion it should apply in the Electric Vehicle (EV) industry over the next several years, whereas it should no longer apply in the Internal Combustion Engine (ICE) vehicle industry. It probably won’t apply to ICE vehicle manufacturing in the future because the production rate of such vehicles appears to have peaked on a long-term basis. As evidence we cite the following chart of light vehicle sales in the US since the mid-1970s. This chart shows that the 9-month moving average of annualised light vehicle sales in the US peaked in 2005 and is lower today than it was in the mid-1980s.


Chart Source: advisorperspectives.com

Total light vehicle sales have peaked in many parts of the world, but EV sales are experiencing exponential growth. This implies that vehicle components that are specific to EVs, most notably batteries and electric motors, are going to get cheaper and cheaper. This will not only improve the economics of EVs in absolute terms, it will improve the economics of EVs relative to ICE vehicles.

Taking into account the life-of-vehicle cost, that is, the cost to buy plus the on-going costs to run and maintain, EVs already are competitive with ICE vehicles without the requirement for government subsidies, but within the next three years the economic benefits of choosing an EV over an ICE vehicle will become irresistible to most new car buyers in developed countries. This will happen with or without government incentives to buy EVs. It will happen because of Wright’s Law.

An implication is that current car and truck manufacturers that can’t figure out how to make EVs that consumers want to buy will disappear. Another implication will be a large increase in demand for the commodities that go into vehicle components that are specific to EVs. The commodities that spring to mind are the rare earth metals Neodymium and Praseodymium (NdPr), which are used in electric motors, and lithium, nickel and manganese, which are used in EV batteries.

Keep in mind, though, that the size of the EV market is limited by an overall light vehicle market that probably will be smaller in 15 years than it is today, because the combination of self-driving and ride-sharing will bring the age of personal car ownership to an end.

Wright’s Law naturally results in huge benefits for the average person, but central bankers think that they have to fight it. Even though prices naturally fall over time due to economic progress, central bankers believe that prices should rise, not fall. Therefore, they deliberately try to counteract the efficiency improvements that people in the marketplace are constantly trying to create. They do so by pumping new money into the economy or by encouraging commercial banks to lend new money into existence.

In general, the fast-growing industries that are focused on technological advancement are still able to reduce prices in the face of the central bank’s price-distorting efforts. This leads to the price rises being concentrated in industries where, due to government regulations or the nature of the industry, there is less scope for technology to drive prices downward. For example, Amazon.com was able to drive prices downward in the face of the Fed’s “inflationary” efforts, but most of its brick-and-mortar competitors were not. Other examples are the education and healthcare industries, where regulations and direct government ownership get in the way.

It’s hard to overstate the stupidity of a central bank strategy that is designed to make the economy less efficient. Currently we have the absurd situation in which the faster the rate of technological progress, the more that central banks do to create “inflation” and thus offset the benefits of this progress. They aren’t doing this because they are malicious, they are doing it because they are trapped within an ideological framework that prevents them from understanding the way the world works.

Another look at gold versus inflation expectations

October 13, 2020

I discussed the relationship between gold and inflation expectations a couple of times in blog posts last year (HERE and HERE). Contrary to popular opinion, gold tends to perform relatively poorly when inflation expectations are rising and relatively well when inflation expectations are falling.

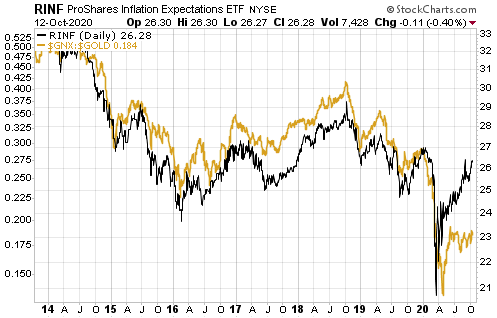
The relationship is illustrated by the chart displayed below. The chart shows that over the past seven years there has been a strong positive correlation between RINF, an ETF designed to move in the same direction as the expected CPI, and the commodity/gold ratio (the S&P Spot Commodity Index divided by the US$ gold price). In other words, the chart shows that a broad basket of commodities outperformed gold during periods when inflation expectations were rising and underperformed gold during periods when inflation expectations were falling.

This year, inflation expectations crashed during February-March in reaction to the draconian economic lockdowns imposed by governments and then recovered after central banks and governments tried to mitigate the lockdown-related devastation by showering the populace with money. This resulted in a crash in the commodity/gold ratio early in the year followed by a rebound in commodity prices relative to gold beginning in April.

RINF_GNXgold_121020

The above chart shows that the rebound in the commodity/gold ratio from its April-2020 low was much weaker than the rebound in inflation expectations. This happened because there are forces in addition to inflation expectations that act on the commodity/gold ratio and some of these forces have continued to favour gold over commodities. Of particular relevance, the rise in inflation expectations has been less about optimism that another monetary-inflation-fuelled boom is being set in motion than about concerns that a) the official currency is being systematically destroyed and b) the private sector’s ability to produce has been curtailed on a semi-permanent basis.

Inflation expectations probably will continue to trend upward over the coming 12 months and this should lead to additional strength in industrial commodities relative to gold, but less strength than implied by the relationship depicted above. It probably will happen this way because more and more economic activity will be associated with government spending, which does nothing for long-term progress.

Eventually the relationship depicted above will be turned on its head due to plummeting confidence in both the government and the central bank, that is, at some point rising inflation expectations will start being associated with an increase in the perceived value of gold relative to commodities and pretty much everything else.

Gold mining fundamentals remain supportive

September 29, 2020

[This blog post is a modified excerpt from a recent TSI commentary]

It is estimated that about 50% of the production costs of the average gold miner are linked to energy. That’s why the gold/oil ratio is a reasonable proxy for the average profit margin across the gold mining industry.

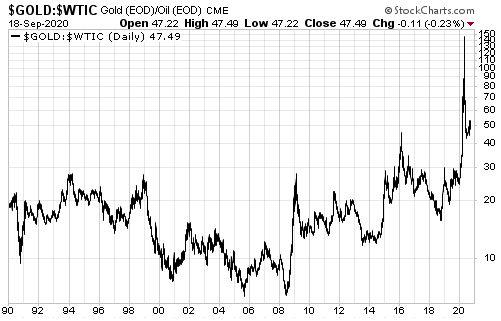
The gold/oil ratio peaked in April of this year and then plunged. Refer to the following chart for the details. It’s a good bet that the April-2020 peak was the major (long-term) variety since it was driven by a spectacular collapse in the oil price that almost certainly won’t be repeated within the next few years. This implies that the industry-wide gold mining profit margin peaked on a long-term basis during the first half of this year.

For two reasons, the high probability that the gold/oil ratio peaked on a long-term basis 5-6 months ago is not bearish for gold mining stocks.

The first reason is that the plunge in the gold/oil ratio from its April-2020 peak ended with the ratio at a multi-decade high. In other words, by historical standards the gold price is still very high relative to the cost of energy, meaning that gold mining profit margins remain elevated. That’s why we expect the gold mining indices/ETFs to trade at much higher levels within the next 12 months.

The second reason is that when the gold/oil ratio retains about half of its gain from a major low (in this case in 2018) to a major high, which it has done to date, the time from a major gold/oil ratio peak to a major gold mining peak tends to be 1.5-2.5 years. This implies that the cyclical advance in the gold mining sector that began in 2018 won’t end before the second half of 2021, although be aware that a sustained move below 40 in the gold/oil ratio would warn a multi-year peak was either in place or close.

The inflationary depression of the 2020s

September 22, 2020

[This blog post is an excerpt from a recent TSI commentary]

The 4-8 year period beginning in February of this year potentially will contain three or more official recessions and come to be referred to as the Depression of the 2020s. If so, unlike the Depression of the 1930s the Depression of the 2020s will be inflationary.

The Depression of the 1930s was deflationary in every sense of the word, but the primary cause of the deflation was the performance of the money supply. We don’t have the data to calculate True Money Supply (TMS) during the 1930s, but we have the following chart showing what happened to the M1 and M2 monetary aggregates from 1920 to 1953. The chart shows that there was a substantial contraction in the US money supply during 1929-1933 and that the money supply was no higher in 1938 than it had been at the start of the decade.

Clearly, the money-supply situation today could not be more different from the money-supply situation during the early-1930s*.

One reason for the difference is that during the 1930s the Fed was restricted by the Gold Standard. The Gold Standard was diluted in 1933, but throughout the 1930s the US$ was tethered to gold.

The final official link between the US$ and gold was removed in 1971. This made it possible for the Fed to do a lot more, but as far as we can tell the Fed actually didn’t do a lot more in the 1990s than it did in the 1960s. It has been just the past 20 years, and especially the past 12 years, that the Fed has transmogrified from an institution that meddles with overnight interest rates and bank reserves to a central planning agency that attempts to micro-manage the financial markets and the economy. After history’s greatest-ever mission creep, it now seems that there is nothing associated with the financial markets and the economy that is outside the Fed’s purview.

In parallel with the expansion of the Fed’s powers and mission there emerged the idea that for a healthy economy the currency must lose purchasing power at the rate of around 2% per year. This idea has come to dominate the thinking of central bankers, but it has never been justified using logic and sound economic premises. Instead, when asked why the currency must depreciate by 2% per year, a central banker will say something along the lines of: “If the inflation rate drops well below 2% then it becomes more difficult for us to implement monetary policy.”

As an aside, because of the way the Fed measures “inflation”, for the Fed to achieve its 2% “inflation” target the average American’s cost of living probably has to increase by at least 5% per year.

Due to the central-banking world’s unshakeable belief that money must continually lose purchasing power and the current authority of the central bank to do whatever it takes to achieve its far-reaching goals, the greater the perceived threat of deflation the more monetary inflation there will be. We saw an example of this during 2001-2002 and again during 2008-2009, but 2020 has been the best example yet. The quantity of US dollars created since the start of this year is greater than the entire US money supply in 2002.

It actually would be positive if deflation were the high-probability outcome that many analysts/commentators claim it is, because deflation is relatively easy to prepare for and because 1-2 years of severe deflation would set the stage for strong long-term growth. However, one of today’s dominant driving forces is the avoidance of short-term pain regardless of long-term cost, so there will be nothing but inflation until inflation is perceived to be the source of the greatest short-term pain. This doesn’t mean that a depression will be sidestepped or even postponed. What it means is that the next depression — which may have already begun — will be the inflationary kind.

*US True Money Supply (TMS) has expanded by 35% over the past 12 months.