[This is an excerpt from a commentary published at TSI on 16th August 2020. The message remains applicable.]
The US$ commenced a cyclical decline in March of this year and probably will trade well below current levels during the first half of 2021. From the perspective of our investing and trading, the main consequences of this weakness in the senior currency are:
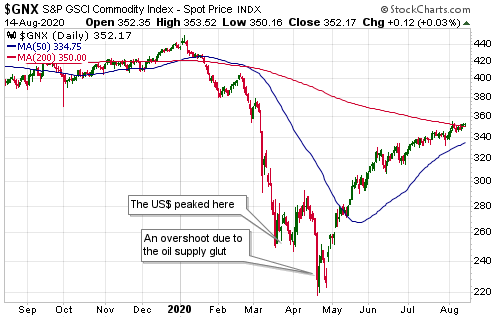
1) Broad-based strength in the commodity markets. As illustrated below, the S&P Spot Commodity Index (GNX) has been trending upward since shortly after the US$ peaked.
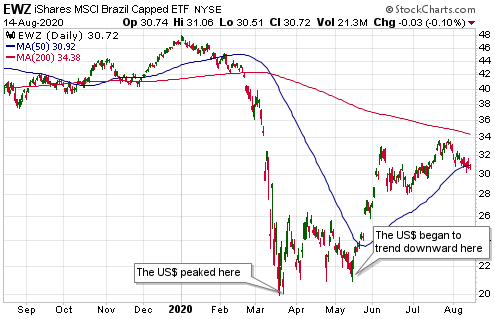
2) Strength in emerging market equities, especially the equities that are based in emerging economies that rely heavily on commodity exports. For example, Brazilian equities. Despite the debilitating effects on Brazil’s economy of virus-related lockdowns, the following chart shows that the iShares Brazil ETF (EWZ) has done well since the US$ began trending downward.
Note that it could make sense to buy EWZ if there’s a pullback to US$26-$28 within the next several weeks.
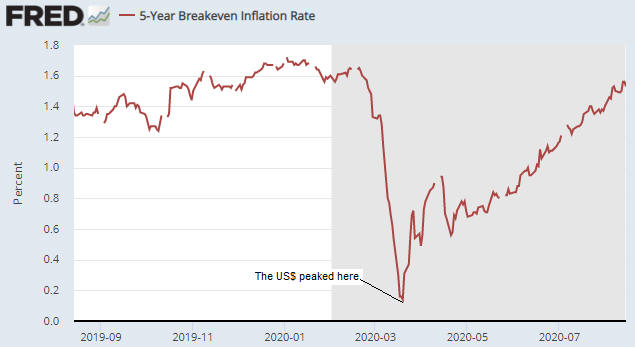
3) Rising US inflation expectations. As illustrated below, the US 5-Year Breakeven Rate (the annual CPI increase that the market expects the US government to report over the next few years) has been trending upward since the US$ peaked.
The above consequences have been apparent over the past few months and should become more pronounced within the next 12 months, especially during the first half of next year. However, we think that in the short-term the focus of investors/speculators should be on the potential for a US$ rebound.
It’s possible that the Dollar Index (DX) will become more stretched to the downside before it commences a meaningful countertrend rally, but once a US$ rebound begins in earnest the prices that have been elevated over the past few months by US$ weakness, which means the prices of almost everything, will fall.
It does not make sense to exit all anti-US$ trades in anticipation of a short-term US$ rally. Doing so would be risky because these trades would make large additional gains if the US$ rebound were to be postponed for a month or two. Also, making a complete exit would create the problem of having to time the re-entry. However, it would make sense to hedge against a short-term US$ recovery while maintaining core exposure in line with the dollar’s longer-term weakening trend.