[This blog post is a modified excerpt from a recent TSI commentary]
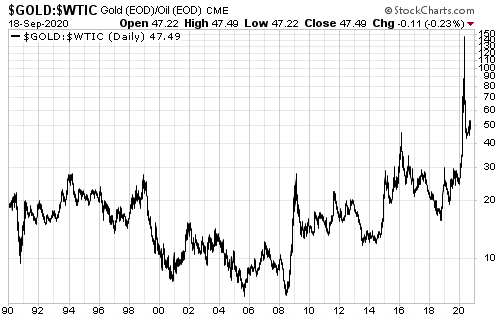
It is estimated that about 50% of the production costs of the average gold miner are linked to energy. That’s why the gold/oil ratio is a reasonable proxy for the average profit margin across the gold mining industry.
The gold/oil ratio peaked in April of this year and then plunged. Refer to the following chart for the details. It’s a good bet that the April-2020 peak was the major (long-term) variety since it was driven by a spectacular collapse in the oil price that almost certainly won’t be repeated within the next few years. This implies that the industry-wide gold mining profit margin peaked on a long-term basis during the first half of this year.

For two reasons, the high probability that the gold/oil ratio peaked on a long-term basis 5-6 months ago is not bearish for gold mining stocks.
The first reason is that the plunge in the gold/oil ratio from its April-2020 peak ended with the ratio at a multi-decade high. In other words, by historical standards the gold price is still very high relative to the cost of energy, meaning that gold mining profit margins remain elevated. That’s why we expect the gold mining indices/ETFs to trade at much higher levels within the next 12 months.
The second reason is that when the gold/oil ratio retains about half of its gain from a major low (in this case in 2018) to a major high, which it has done to date, the time from a major gold/oil ratio peak to a major gold mining peak tends to be 1.5-2.5 years. This implies that the cyclical advance in the gold mining sector that began in 2018 won’t end before the second half of 2021, although be aware that a sustained move below 40 in the gold/oil ratio would warn a multi-year peak was either in place or close.
 Print This Post
