[This post is an excerpt from a recent TSI commentary]
This year has been nothing if not interesting. Many unprecedented things have happened, one example being the performance of the US Industrial Production (IP) Index. As shown below, IP effectively fell off a cliff during March-April of this year. During May-July it climbed about half-way back up the cliff face before stopping in its tracks over the past two months. Nothing like this ever happened before.
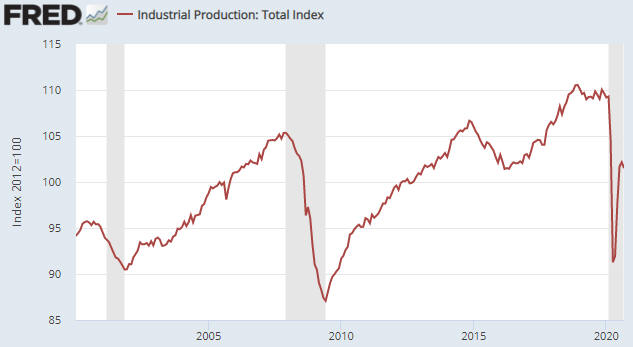
When we say nothing like this ever happened before we are referring to the speed of the change. In magnitude terms the IP Index suffered a similar peak-to-trough decline during the Global Financial Crisis, but what took eighteen months during 2007-2009 took only two months in 2020. And after the 2007-2009 recession it took about two years for the IP Index to recover half of what it lost, as opposed to three months in 2020. In other words, what took 3.5 years during 2007-2011 took only five months in 2020.
The reason for the unprecedented speed of this year’s collapse is that the US economy didn’t fall off a cliff; it was pushed. The government (meaning: politicians and bureaucrats at the federal and state levels) deliberately crashed the economy. Policymakers then mounted such an extraordinary rescue attempt that personal income actually rose while the economy crashed and unemployment soared, which explains the unprecedented speed of the rebound.
The economic recovery stalled over the past two months (the IP Index for September was roughly the same as the IP Index for July), mainly because the government slowed the pace at which it was doling out ‘free’ money. The pace of the government’s money distribution is bound to ramp up after the November election, which probably will enable the economy to look strong during the first half of next year. However, there is no chance of a self-sustaining recovery. The main reason is that deluging the populace with newly created money does nothing to repair the damage caused by the lockdowns. On the contrary, it leads to capital consumption and sets the stage for another plunge into recession territory.
The biggest risk, however, isn’t that the ‘stimulus’ efforts won’t work and that the US economy will be back in recession within the next two years. That’s more of an inevitability than a risk. The risk of greatest concern is that policymakers will become even more aggressive in their misguided efforts to help and that these efforts will lead to hyperinflation.
For the first time since we started publishing these reports two decades ago, we cannot write that the probability of the US experiencing hyperinflation within the next two years is close to zero. The probability isn’t high, but it is significant.