In a blog post in March of this year I discussed the limitations of sentiment as a market timing tool. I wrote that while it can be helpful to track the public’s sentiment and use it as a contrary indicator, there are three potential pitfalls associated with using sentiment to guide buying/selling decisions. Here are the pitfalls again:
The first is linked to the reality that sentiment generally follows price, which makes it a near certainty that the overall mood will be at an optimistic extreme near an important price top and a pessimistic extreme near an important price bottom. The problem is that while an important price extreme will always be associated with a sentiment extreme, a sentiment extreme doesn’t necessarily imply an important price extreme.
The second potential pitfall is that what constitutes a sentiment extreme will vary over time, meaning that there are no absolute benchmarks. Of particular relevance, what constitutes dangerous optimism in a bear market will often not be a problem in a bull market and what constitutes extreme fear/pessimism in a bull market will often not signal a good buying opportunity in a bear market.
The third relates to the fact that regardless of what sentiment surveys say, there will always be a lot of bears and a lot of bulls in any financial market. It must be this way otherwise there would be no trading and the market would cease to function. As a consequence, if a survey shows that almost all traders are bullish or that almost all traders are bearish then the survey must be dealing with only a small — and possibly not representative — segment of the overall market.
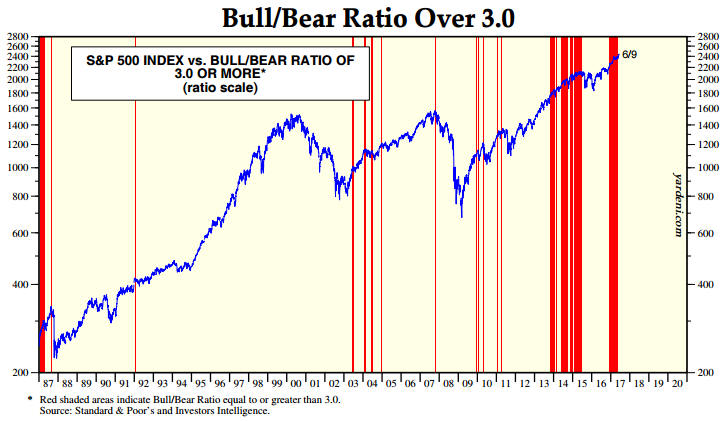
I went on to write that there was no better example of sentiment’s limitations as a market timing indicator than the US stock market’s performance over the past few years. To illustrate I included a chart from Yardeni.com showing the performance of the S&P500 Index (SPX) over the past 30 years with vertical red lines to indicate the weeks when the Investors Intelligence (II) Bull/Bear ratio was at least 3.0 (a bull/bear ratio of 3 or more suggests extreme optimism within the surveyed group). An updated version of the same chart is displayed below.
The chart shows that while vertical red lines (indicating extreme optimism) coincided with most of the important price tops (the 2000 top being a big exception), there were plenty of times when a vertical red line did not coincide with an important price top. It also shows that optimism was extreme almost continuously from Q4-2013 to mid-2015 and that following a correction the optimistic extreme had returned by late-2016.
Sentiment was at an optimistic extreme late last year, at an optimistic extreme when I presented the earlier version of the following chart in March and is still at an optimistic extreme. In effect, sentiment has been consistent with a bull market top for the bulk of the past four years, but there is still no evidence in the price action that the bull market has ended.
Regardless of what happens from here, four years is a long time for a contrarian to be wrong.