Is the Fed surreptitiously tightening?

September 14, 2016

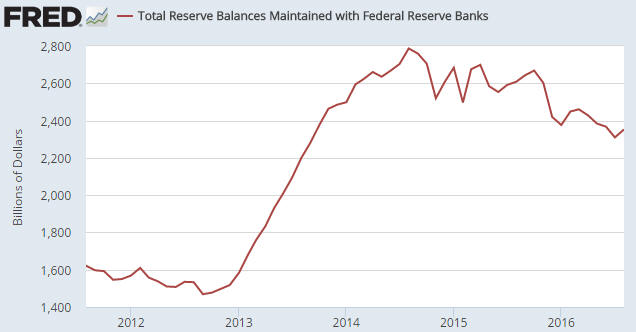
The following chart shows that on a monthly closing basis, bank reserves held at the Fed peaked in August of 2014 at $2.79T and by August-2016 had shrunk to $2.35T. This amounts to a $440B decline in bank reserves over the space of two years. Furthermore, $320B of this $440B decline happened since last October. Does this mean that while the financial world vigorously debates whether the Fed will/should take a ‘baby step’ along the rate-hiking path next week, behind the scenes the Fed has been tightening the monetary screws for 2 years and especially over the past 10 months?

BankReserves_130916

In a word, no. Up until now the Fed has done nothing to tighten monetary conditions.

I am, of course, aware that there was a tiny increase in the Fed’s targeted interest rate last December, but this rate hike was not implemented via a money-supply or reserve reduction and therefore did not constitute genuinely-tighter monetary policy. What, then, is the explanation for the significant reduction in bank reserves held at the Fed?

Before getting to the explanation I’ll reiterate that there are only three ways for US commercial bank reserves to decline. They can be converted to physical currency in circulation in response to increasing demand on the part of the public for notes and coins, they can be shifted to other accounts at the Fed, or they can be removed by the Fed. Only the last of these constitutes monetary tightening by the Fed.

Part of the explanation for the decline in bank reserves is the increasing demand on the part of the public for notes and coins. Due to “inflation”, this demand increases almost every year and is satisfied by the conversion of reserves into physical currency. This naturally has the effect of reducing bank reserves, but the process does not change the money supply because the physical currency replaces electronic currency. For example, when you withdraw $100 at an ATM, $100 is converted from electronic form to paper form while the total money supply is obviously unaffected. This $100 of ‘paper’ comes from the bank’s reserves.

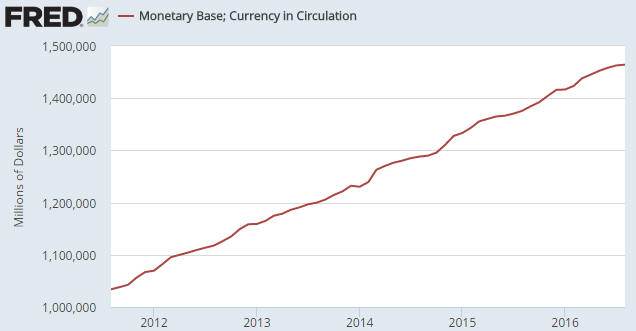
The following chart shows the steady increase in “Currency in Circulation” over the past 5 years. As noted above, this increase involves the siphoning of reserves (in physical form) out of the banking system to replace electronic money. An implication is that if the Fed does nothing and the public’s demand for physical notes/coins is rising, bank reserves will dissipate over time.

MonetaryBase_130916

Since last October, when the rate of decline in bank reserves accelerated, “Currency in Circulation” has risen from $1392B to $1464B, or by $72B. In other words, increasing demand for physical notes/coins only explains $72B of the $320B reduction in reserves since last October. If the remaining $248B reduction wasn’t due to the actions of the Fed, what caused it?

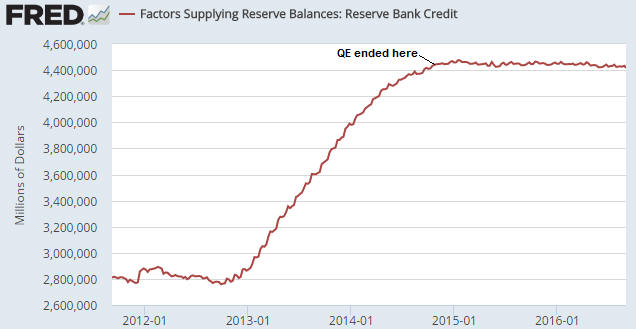
Before I answer the above question I’ll provide evidence that the reserve reduction wasn’t engineered by the Fed. The evidence is the following chart showing total Federal Reserve Credit. Notice that Total Fed Credit has flat-lined since the end of QE in October-2014. This indicates that since October-2014 the Fed has not made any sustained additions to or deletions from the quantity of money or the quantity of bank reserves.

FedCredit_130916

Getting back to the question asked above, the answer is the US Treasury. More specifically, about 90% of the remaining $248B reduction in bank reserves has been caused by the US Treasury hoarding a lot more cash than usual at the Fed.

As I mentioned earlier in this piece, bank reserves can’t leave the Fed unless they are removed by the Fed or get converted to physical currency in response to increasing public demand for notes/coins, but they can get shifted to other (non-reserve) accounts at the Fed. One of these accounts is called the US Treasury General Account, which, as the name suggests, is the US government’s account at the Fed.

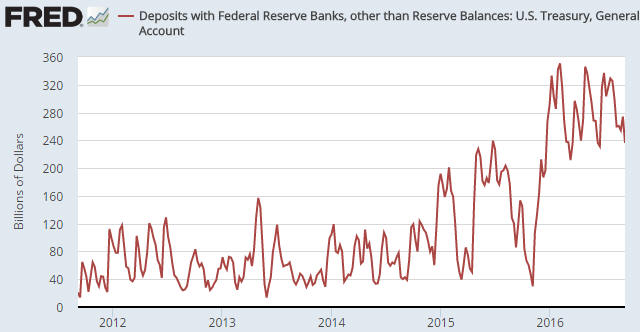
As illustrated by the following chart, the Treasury General Account was about $50B at the end of October last year and was about $275B at the end of August this year. This means that over the 10-month period beginning in November of last year the US Treasury removed about $225B from the economy-wide money supply and removed the equivalent amount from bank reserves.

Just to be clear, the government removes trillions of dollars per year from the economy, but it normally recycles the money very quickly. Usually, money comes in one door via taxation or borrowing and immediately goes out another door. The difference this year is that the Federal Government has been maintaining a much higher ‘cash float’ than usual.

TreasuryAcct_130916

I don’t know why the US Federal government has suddenly started keeping a lot more cash in reserve. Perhaps the leadership wants to make sure that, come what may, there will always be plenty of ready cash to pay the salaries/benefits of politicians and senior bureaucrats.

Print This Post Print This Post

Explaining the moves in the gold price

September 9, 2016

Here is a brief excerpt, with updated charts, from a recent commentary posted at TSI.

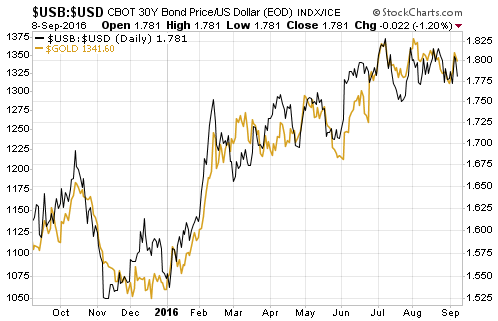
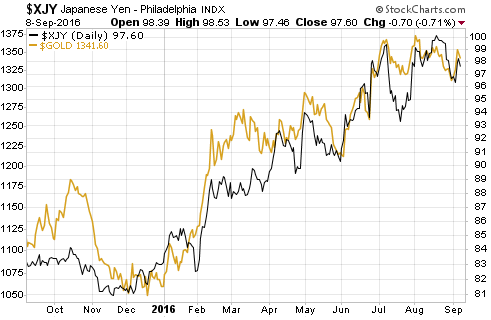
If you read some gold-focused web sites you could come away with the belief that movements in the gold price are almost completely random, depending more on the whims/abilities of evil manipulators and the news of the day than on genuine fundamental drivers. The following two charts can be viewed as cures for this wrongheaded belief.

The first chart compares the performance of the US$ gold price with the performance of the bond/dollar ratio (the T-Bond price divided by the Dollar Index). The charts are almost identical, which means that the gold price has been moving in line with a quantity that takes into account changes in interest rates, inflation expectations and currency exchange rates. The second chart shows that the US$ gold price has had a strong positive correlation with the Yen/US$ exchange rate. As we’ve explained in the past, gold tends to have a stronger relationship with the Yen than with any other currency because the Yen carry trade makes the Yen behave like a safe haven.

gold_USBUSD_090916

gold_Yen_090916

There are two possible explanations for the relationships depicted above. One is that the currency and bond markets, both of which are orders of magnitude bigger than the gold market, are being manipulated in a way that is designed to conceal the manipulation of a market that hardly anyone cares about. The other is that the gold price generally does what it should do given the performances of other financial markets. Only one of these explanations makes sense.

Print This Post Print This Post
Sorry, the trend is not your friend

September 7, 2016

There’s an old saying in the financial markets that the trend is your friend, meaning that you will do well as long as you position your trades in line with the current price trend. This sounds good. The only problem is that you can never know what the current trend is; you can only know what the trend was during some prior period. How is it possible for something you can never know to be your friend?

Market ‘technicians’ often make comments such as “the trend for Market X is up” and “Market Y is in a downward trend” as if they were stating facts. They are not stating facts, they are stating assumptions that have as much chance of being wrong as being right.

A statement such as “Market X’s trend is up” would more correctly be worded as “I’m going to assume that Market X’s trend is up unless proven otherwise”. The proving otherwise will generally involve the price moving above or below a certain level, but the selection of this level is yet another assumption and the price moving above/below any particular level will provide no factual information about the current trend.

To further explain, let’s say that a market made a sequence of higher highs and higher lows over a 3-month period. It can be said that during this period the market’s trend was up. That’s a fact, since the definition of an upward trend is a sequence of rising highs and lows. However, even if this market has just made a new high it is not a fact that the current trend is up, because the high that was just made could turn out to be the ultimate high prior to the start of a downward trend. Nobody knows whether it will or won’t be the ultimate high, but some traders will assume that it was — or was very close to — the ultimate high and sell, while other traders will assume that the trend is still up. The members of the first group have approximately the same probability of being right as the members of the second group, but many members of the second group (the trend-followers) will unequivocally state “the trend is up”.

In the above hypothetical case, let’s assume that the first group was right and that the price immediately started to trend downward. Most members of the second group will have in mind price levels at which they will stop assuming that the trend is up, but the point at which their assumption changes could turn out to be the bottom. In other words, having wrongly assumed that the trend was still up after the price had just peaked, they might subsequently make the incorrect assumption that the trend has changed from up to down at the time that it is actually changing from down to up.

The impossibility of knowing the direction of the trend in real time is one of the reasons that the majority of trend-following traders end up losing money. Looking from a different angle, if it were possible to KNOW the direction of the trend in real time then every half-decent trend-follower would generate good returns, but very few of them do generate good returns over the long haul.

As an aside, the majority of non-trend-following traders also end up losing money. The fact is that regardless of what method is used, trading success over the long haul is primarily about risk management.

So, just be aware that when you read comments along the lines of “the trend is up”, the author is not stating a fact. He is, instead, announcing an opinion (making an assumption) that could be wrong.

Print This Post Print This Post
Is the US economy too weak for a Fed rate hike?

September 6, 2016

Some analysts argue that the US economy is strong enough to handle some rate-hiking by the Fed. Others argue that with the economy growing slowly the Fed should err on the side of caution and continue to postpone its next rate hike. Still others argue that the economy is so weak that the Fed not only shouldn’t hike its targeted interest rate, it should be seriously considering a rate CUT and other stimulus measures. All of these arguments are based on a false premise.

The false premise is that the economy is boosted by forcing interest rates to be lower than they would otherwise be. It should be obvious — although apparently it isn’t — that an economy can’t be helped by falsifying the most important of all price signals.

When a central bank intervenes to make interest rates lower than they would be in a free market, a number of things happen and none of these things are beneficial to the overall economy.

First, there will be a forced wealth transfer from savers to borrowers, leading to less saving. To understand why this is an economic problem in addition to being an ethical problem, think of savings as the economy’s seed corn. Consume enough of the seed corn and there will be no future crop.

Second, construction, mining and other projects that would not be economically viable in a less artificial monetary environment are temporarily made to look viable. A result is that a lot of real resources are directed towards projects that end up failing.

Third, investors seeking an income stream are forced to take bigger risks to meet their requirements and/or obligations. In effect, conservative investors are forced to become aggressive speculators. This inevitably leads to massive and widespread losses down the track.

Fourth, debt becomes irresistibly attractive and starts being used in counter-productive ways. The best example from the recent past is the trend of US corporations taking-on increasing amounts of debt for the sole purpose of buying back their own equity. Going down this path is a much quicker way of boosting earnings per share than investing in the growth of the business, so, naturally, the increasing popularity of debt-financed share buy-backs has gone hand-in-hand with reduced capital spending.

Fifth, “defined benefit” pension funds end up with huge deficits.

The reality is that the economy cannot possibly be helped by centrally forcing interest rates to be either lower or higher than they would be if ‘the market’ were allowed to work. The whole debate about whether the US economy is strong enough to handle another Fed rate hike is therefore off base.

The right question is: How much more of the Fed’s interest-rate manipulation can the US economy tolerate?

Print This Post Print This Post