The next major gold rally

August 17, 2018

[This post is a brief excerpt from a recent TSI commentary]

During the first three quarters of 2016 we were open to the possibility that a new cyclical gold bull market got underway in December of 2015, but over the past 18 months we have been consistent in our opinion that the December-2015 upward reversal in the US$ gold price did NOT mark the start of a bull market. Since late-2016 there have been some interesting rallies in the gold price, but at no time has there been a good reason to believe that we were dealing with a bull market. That’s still the case. The question is: what will it take to set a new cyclical gold bull market in motion?

The simple answer is that it will take a US equity bear market. However, this is not a practical answer because in real time there often will be no way of differentiating the first 6-9 months of an equity bear market from an intermediate-term bull-market correction. The most practical answer we can come up with is that it will take an upward reversal in the yield curve.

It has become popular to argue that due to extraordinary monetary policy the yield curve is not as important as it was in the past, but we strongly disagree. In our opinion the yield curve is, if anything, more important now — in the face of extraordinary monetary policy — than it has ever been.

The potential for the US yield curve to invert in the not-too-distant future is a red herring. Except to the extent that it influences the psychology of senior Fed officials, whether or not the curve inverts is neither here nor there. It’s the reversal from ‘flattening’ to ‘steepening’ that matters, regardless of whether the reversal happens before or after the curve inverts.

If the next major reversal of the yield curve is driven primarily by falling short-term interest rates then it will signal the onset of an economic bust. An economic bust would naturally coincide with an equity bear market and the start of a gold bull market. On the other hand, if the next major reversal of the yield curve is driven primarily by rising long-term interest rates then it will signal the onset of an inflationary blow-off that likely would go hand-in-hand with a powerful 1-2 year rally in the gold price and the prices of most other commodities.

Last week the 10yr-2yr yield spread, a proxy for the US yield curve, fell to within 2 basis points of the 10-year low reached in mid-July. Therefore, at this time there is no sign of an upward reversal.

Gold: Bearish fundamentals, bullish sentiment

August 13, 2018

For the first time this year, about two weeks ago the sentiment backdrop became decisively supportive of the gold price and remains so. At the same time, the fundamental backdrop is unequivocally bearish for gold. What will be the net effect of these counteracting forces?

Before attempting to answer the above question let’s briefly review the most important sentiment and fundamental indicators.

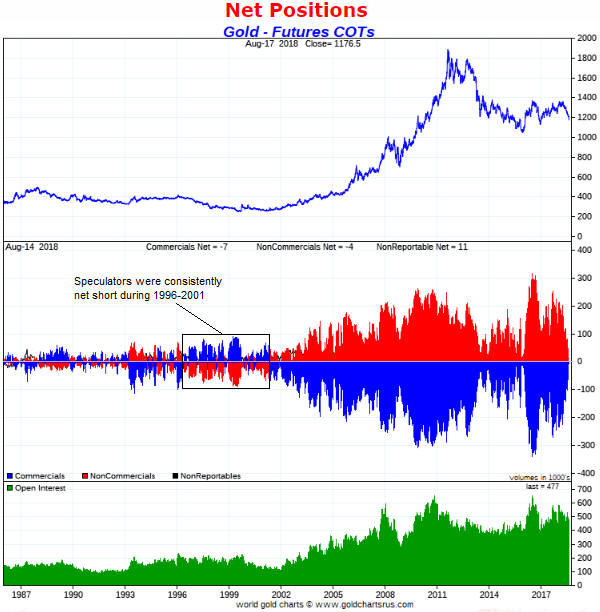
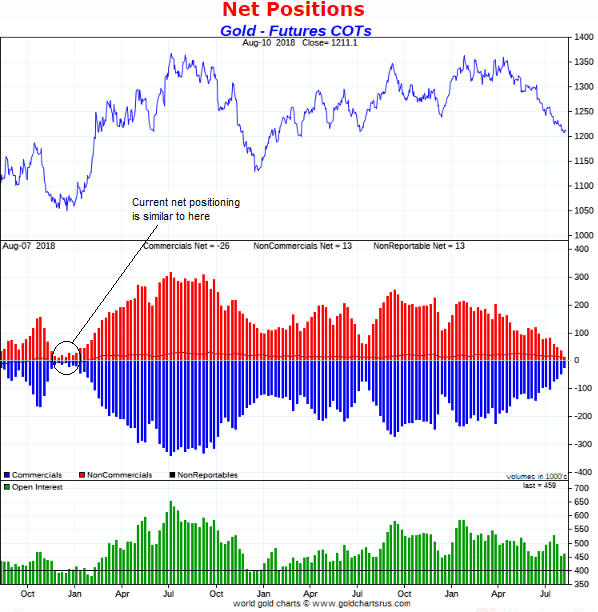
The following chart from goldchartsrus.com shows that at Tuesday 7th August (the date of the latest COT data) the net positioning of traders in gold futures was similar to what it was in December-2015, which is when a powerful 7-month rally was about to begin. Therefore, in terms of net positioning the COT situation (the most useful of all the gold-market sentiment indicators) is as bullish as it has been in many years.

The one concern is that while the open interest (the green bars in the bottom section of the following chart) is well down from where it was a month ago, it is still more than 50K contracts above where it was at the December-2015 and December-2016 price lows (the two most important price lows of the past five years). The open interest may have to drop to 400K contracts or lower before there is a strong, multi-month rally.

goldCOT_130818

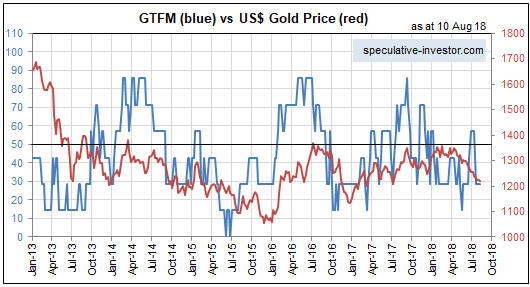
There are a number of important fundamental drivers of the US$ gold price, including credit spreads, the yield curve, the real interest rate (the TIPS yield), the relative strength of the banking sector and the US dollar’s exchange rate. The most important seven gold-market fundamentals are incorporated into our Gold True Fundamentals Model (GTFM), a chart of which is displayed below.

The GTFM was ‘whipsawed’ between late-June and mid-July, in that during this short period it shifted from bearish to bullish and then back to bearish. Apart from this 2-3 week period it has been continuously bearish since mid-January.

GTFM_130818

Returning to the question posed in the opening paragraph, regardless of what happens on the sentiment front there will not be an intermediate-term upward trend in the gold market until the fundamental backdrop turns gold-bullish. The fundamentals are constantly in flux and potentially will turn bullish within the next few weeks, but at this time there is no good reason to expect that an intermediate-term gold rally is about to begin.

However, with the right sentiment situation a strong short-term rally can occur in the face of bearish fundamentals. This is what happened between late-June and early-September of 2013. During this roughly 2-month period there was a $200 increase in the gold price in the face of a gold-bearish fundamental backdrop.

The gold market was far more ‘oversold’ in late-June of 2013 than it is today, but it is sufficiently depressed today to enable a short-term rebound of at least $100 even without a significant improvement (from gold’s perspective) in the fundamentals.

That doesn’t mean that we should expect a $100+ rebound to get underway in the near future, only that — thanks to the depressed sentiment — the potential is there. Before the potential starts being realised the price action will have to signal a reversal.

A different look at the US yield curve

August 6, 2018

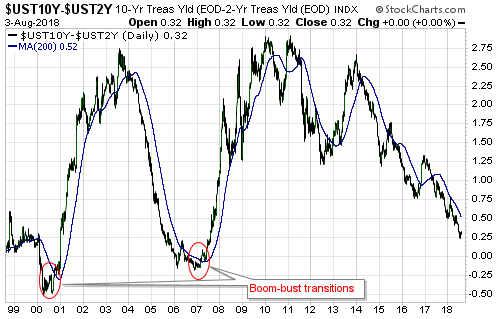
The US yield curve, as indicated by the spread between the 10-year and 2-year T-Note yields, made a new 10-year extreme over the past fortnight, meaning that it recently became the ‘flattest’ it has been in more than 10 years. While this may indicate that the boom is nearing its end, it definitely indicates that the transition from boom to bust has not yet begun.

As explained numerous times in the past, the ‘flattening’ of the yield curve (short-term interest rates rising relative to long-term interest rates) is a characteristic of a monetary-inflation-fueled economic boom. It doesn’t matter how flat the yield curve becomes or even if it becomes inverted, the signal that the boom has ended and that a bust encompassing a recession is about to begin is the reversal of the curve’s major trend from flattening to steepening. To put it another way, the signal that the proverbial chickens are coming home to roost is short-term interest rates peaking RELATIVE TO long-term interest rates and then beginning to decline relative to long-term interest rates. This generally will happen well before the Fed sees a problem and begins to cut its targeted short-term interest rate.

The following chart highlights the last two major reversals of the US yield curve from flattening to steepening. These reversals were confirmed about 6 months prior to the recessions that began in March-2001 and December-2007.

The fact that the yield curve is still hitting new extremes in terms of ‘flatness’ suggests that the next US recession will not begin before 2019.

yieldcurve_060818

The above is essentially a repeat of what I’ve written in the past, but an additional point warrants a mention. The additional point is that while it would be almost impossible for the US economy to transition from boom to bust without a timely reversal in the yield curve from flattening to steepening, there is a realistic chance that the next yield-curve trend reversal from flattening to steepening will NOT signal the onset of an economic bust/recession. That’s why I do not depend solely on the yield curve when determining recession probabilities.

The reason that the next yield-curve trend reversal from flattening to steepening will not necessarily signal the onset of an economic bust/recession is that there are two potential drivers of such a reversal. The reversal could be driven by falling short-term interest rates or rising long-term interest rates. If it’s the former it signals a boom-bust transition, but if it’s the latter it signals rising inflation expectations.

As an aside, regardless of whether a major yield-curve reversal from flattening to steepening is driven by the unravelling of an artificial boom or rising inflation expectations, it is bullish for gold. By the same token, a major reversal in the yield curve from steepening to flattening is always bearish for gold.

With the T-Bond likely to strengthen for at least the next two months there is little chance that rising long-term interest rates will drive a yield curve reversal during the third quarter of this year, but it’s something that could happen late this year or during the first half of next year.

Have the Chinese pegged the gold price?

July 30, 2018

Governments and central banks lost interest in the gold price decades ago, but stories about how governments are supposedly controlling the gold price never lose their appeal. One of the latest stories is that since the inclusion of the Yuan in the IMF’s SDR (Standard Drawing Rights) basket in October-2016, the Chinese government has pegged the SDR-denominated gold price to 900 +/- a few percent. According to The Macro Tourist’s 25th July blog post, this story has been told by Jim Rickards. The Macro Tourist suggests a different story*, which involves the Chinese government (or someone else) having pegged the Yuan-denominated gold price. Both stories are based on gold’s narrow trading range relative to the currency in question over the past two years.

If we are going to play this game then I can tell an even better story. My story is that the Japanese government took control of the gold market in early-2014 and has since been keeping the Yen-denominated gold price at 137,000 +/- 5%. They lost control in early-2015 and again in early-2018, but in both cases they quickly brought the market back into line.

Here’s the chart that ‘proves’ my version of events:

gold_Yen_300718

The narrow sideways range of the Yen gold price over the past 4.5 years is due to the Yen being the major currency to which gold has been most strongly correlated. Here’s a chart that illustrates the strong positive correlation between Yen/US$ and gold/US$:

goldvsYen_300718

My story about the Japanese government pegging the gold price makes as much sense as the stories about the Chinese government pegging the gold price. That is, my story makes no sense.

It will be possible to find price data to substantiate almost any manipulation story. Also, with sufficient imagination there is no limit to the manipulation stories that can be concocted to explain any price action. For example, you can always look at a period of range-trading in the gold market and conclude that a government (the same organisation that makes a mess of everything else it tries to do) is adeptly managing the price. Alternatively, you can look for a more plausible explanation or perhaps just acknowledge that not all price action has a single, simple explanation.

Like all financial markets the gold market is, of course, manipulated, but even if there were a desire to do so (there isn’t) it would not be possible under today’s monetary system for any government to directly control the gold price over a period of years or alter major trends in the gold price.

*In general the Macro Tourist blog provides level-headed commentary on the financial markets and doesn’t plunge into the murky world of gold-manipulation story-telling. Even in this case I think the main point of the post is to show that gold is stretched to the downside and may be good for a short-term trade, but some people will take the post as more evidence that the gold market is dominated by nefarious forces.