Credit spreads and the stock market

October 16, 2018

This post was prompted by a recent article authored by the always thought-provoking Pater Tenebrarum (a pseudonym) at acting-man.com. The article looks at the relationship between credit spreads and the stock market, in particular the historical tendency for credit spreads to begin widening prior to substantial stock market declines and thus to act as timely warning signals of impending stock market trouble. The conclusion is: “…it seems…more likely that a stock market decline will put pressure on junk bonds, instead of weakness in junk bonds providing advance warning of an impending stock market decline. The stock market sell-off in the past week did in fact very slightly lead a surge in high yield spreads.” I don’t know that this conclusion is wrong, but at this time the evidence to support it is not persuasive.

It first should be understood that credit spreads generally begin widening ahead of bear markets, but they generally DON’T lead short-term stock-market corrections. Therefore, the fact that they didn’t warn of the October-2018 sell-off is not meaningful at this time. It will become meaningful only if the October-2018 sell-off proves to be the first decline in a bear market, which is unlikely.

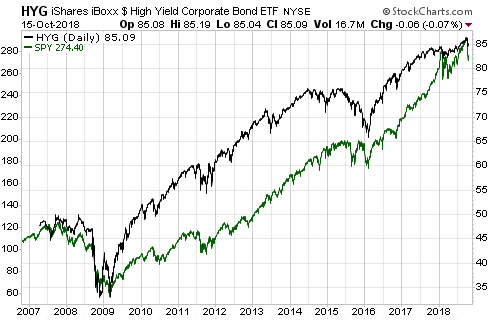
The fact that the most recent stock market sell-off appeared to slightly lead an up-tick (not a surge) in high yield spreads is also not meaningful. The following chart shows that junk bonds often trend with equities (the chart compares the iShares High Yield Corporate Bond ETF with the S&P500 ETF), so actually it is normal for short-term stock market corrections to go hand-in-hand with minor expansions of credit spreads. That’s what happened over the past 2 weeks, what happened in January-February of this year and what happened on numerous other occasions in the past.

HYG_SPY_161018

The above-linked article makes the interesting point that credit spreads in the euro-zone and the US have diverged over the past year, with the former embarking on a widening trend in late-October of last year while the latter continued to contract. If credit spreads were still useful leading indicators of major stock-market trends then this divergence should have been accompanied by dramatic relative weakness in European equities. Since it was accompanied by dramatic relative weakness in European equities this is hardly evidence that credit spreads have lost their usefulness.

Could the influence of QE prevent credit spreads from signaling a trend reversal ahead of the next equity bear market?

I don’t see how. QE led to yield-chasing behaviour, which, in turn, caused credit spreads to become a lot narrower than they would have been. Having been compressed to artificially small quantities, credit spreads should if anything be more sensitive than usual to changes in the financial and economic backdrops.

Summing up, credit spreads have a strong tendency to widen ahead of equity bear markets. It could be different this time, but right now I can’t think of a good reason why it should be different. In any case, there is no need to rely on just one leading indicator.

The ultimate financial crisis will be inflationary

October 15, 2018

I’ve read many comments to the effect that the next financial crisis will be like 2007-2008, only worse. However, the sole reason that many people are talking about a coming 2008-like crisis is because the happenings of 2008 are still fresh in the memory. Market participants often expect the next crisis to look like the last one, but it never does. Consequently, the general prediction about the next financial crisis with the highest probability of success is that it won’t be anything like 2008. It could, for example, revolve around an inflation scare rather than a deflation scare. In fact, the current monetary system’s ultimate financial crisis, meaning the crisis that leads to a new monetary system, will have to be inflationary.

The ultimate financial crisis will have to be inflationary, because deflation scares provide ‘justification’ for central bank money-pumping and thus enable the long-term credit expansion to continue with only minor interruptions. To put it another way, a crisis won’t be system-threatening as long as it can be ameliorated by central banks doing what they do best, which is promote inflation.

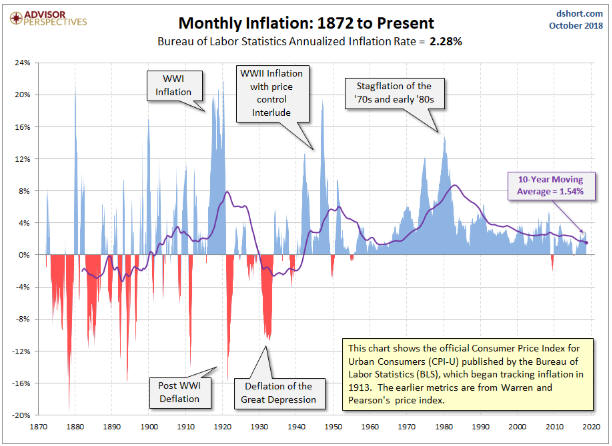
A related point is that a crisis won’t be system-threatening as long as it involves an increase in demand for the official money. The 2007-2008 crisis was such an animal. Like every other crisis in the US since 1940 it did not involve genuine deflation, almost regardless of how the word deflation is defined. The money supply continued to grow, the total supply of credit did no worse than flatten out, and, as illustrated by the following long-term chart, there was nothing more than a downward blip in the Consumer Price Index. However, with the stock market losing more than half its value and commodity prices collapsing, for 6-12 months it sure felt like deflation was happening.

CPI_LT_151018
Chart source: dshort

What actually happened during 2008 was a deflation scare, as opposed to genuine deflation. I define a deflation scare as a period when the total supply of money and credit continues to grow, but a surge in the demand for money makes it seem as if the economy is experiencing severe deflation.

Since there is no limit to the amount of new money and credit that can be created out of nothing by the central bank, it will always be possible for the central bank to keep the current system going in the face of a crisis that involves a surge in the demand to hold the official money. The problem (for the monetary authorities) will occur when the crisis involves a plunge in the demand for the official money. In such a situation the central bank’s most powerful weapon becomes not just ineffective, but counter-productive*.

The bottom line is that regardless of its other details, if the next crisis involves deflation or a deflation scare then it will be just another bump in the road. It will prompt another bout of aggressive money-pumping that will alleviate the perceived shortage of money and eventually inflate new investment bubbles. Only a crisis that entails a decline in the desire to hold the official money can be an existential threat to the monetary system.

*Creating money out of nothing is always counter-productive if the goal is to hasten long-term economic progress, but it can be productive if the goal is to prolong the existence of a debt-based monetary system.

The battle between bearish fundamentals and bullish sentiment continues

October 8, 2018

In a 13th August blog post I noted that for the first time this year the sentiment backdrop had become decisively supportive of the gold price. I also noted that the fundamental backdrop remained unequivocally gold-bearish, and then attempted to answer the question: What will be the net effect of these counteracting forces? My answer was that regardless of sentiment there could not be an intermediate-term upward trend in the gold price until the fundamentals turned gold-bullish, but a $100 short-term rebound was possible even without a significant fundamental improvement. What’s the current situation?

The current situation is similar. Since my 13th August post the sentiment backdrop has become slightly more bullish, the fundamental backdrop has become slightly more bearish, and the price is roughly unchanged at around $1200. Therefore, it’s fair to say that the battle between bearish fundamentals and bullish sentiment has been a draw thus far.

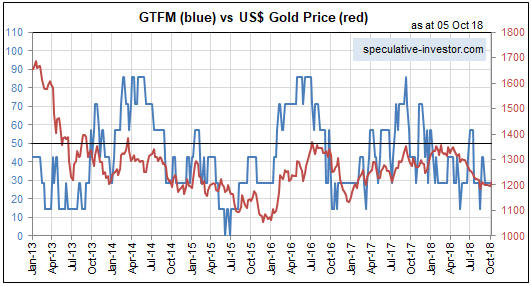
Just to recap, the most important fundamental drivers of the US$ gold price are credit spreads, the yield curve, the real interest rate (the TIPS yield), the relative strength of the banking sector, the US dollar’s exchange rate, the bond/dollar ratio and the general trend of commodity prices. These are the inputs to my Gold True Fundamentals Model (GTFM), a chart of which is displayed below.

Apart from a short period from late-June to mid-July when it was ‘whipsawed’, the GTFM has been continuously bearish since mid-January. No wonder the gold market has struggled this year.

GTFM_081018

The upshot is that due to the bullish sentiment a bounce in the gold price of up to $100 is still a realistic short-term possibility, but due to the bearish fundamentals a much larger rally is not.

The fundamental backdrop is always shifting, so the fact that it is gold-bearish right now doesn’t mean that it will remain so for a long time to come. For example, additional weakness in the stock market would improve gold’s true fundamentals if it caused a significant decline in economic confidence and fostered the belief that the Fed will put its rate-hiking program on hold. However, until/unless such a shift happens, expectations regarding gold’s short-term prospects should be modest.

Five years is a long time to be wrong

October 3, 2018

In a few previous blog posts (for example, HERE) I discussed the limitations of sentiment as a market timing tool. It certainly can be helpful to track the public’s sentiment and use it as a contrary indicator, and some of my most successful trades have been partly based on sentiment extremes. However, these days I place less weight on sentiment than I did in the past.

As mentioned in earlier posts, there is no better example of sentiment’s limitations as a market timing tool than the US stock market’s performance over the past few years. This is evidenced by the following chart from Yardeni.com. The chart shows the performance of the Dow Jones Industrials Index over the past 31 years with vertical red lines to indicate the weeks when the Investors Intelligence (II) Bull/Bear ratio was at least 3.0 (a bull/bear ratio of 3 or more suggests extreme optimism within the surveyed group).

Notice that while vertical red lines (indicating extreme optimism) coincided with some important price tops, there were plenty of times when a vertical red line did not coincide with an important price top. Also, notice that with the exception of a multi-quarter period during 2015-2016 when the market was in correction mode, optimism has been extreme almost continuously since Q4-2013.

In effect, sentiment has been consistent with a bull market top for the bulk of the past five years, but there is still no evidence in the price action that the bull market has ended. On the contrary, while there is a high risk of a significant correction in the short term, the long-term leading indicators I track point to the bull market extending well into 2019.

Regardless of what happens from here, five years is a long time for a contrarian to be wrong.

IIbullbear_031018