
I update gold’s true fundamentals* every week in commentaries and charts at the TSI web site, but my most recent blog post on the topic was on 30th April. At that time the fundamental backdrop was gold-bearish, but there has since been a change.
My Gold True Fundamentals Model (GTFM) turned bearish in mid-January 2018 and was still bearish at the end of the week before last (22nd June). There were fluctuations along the way, but at no time between mid-January and late-June was the fundamental backdrop supportive of the gold price. However, at the end of last week (29th June) the GTFM turned bullish. The deciding factor was a small, but significant, widening of credit spreads.
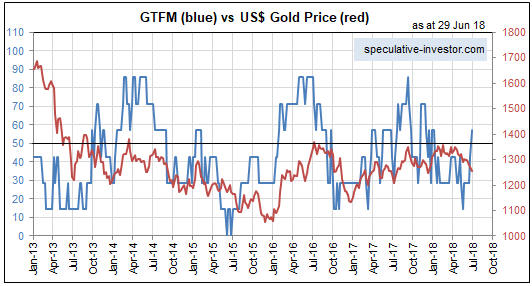
Here is a chart comparing the GTFM (in blue) with the US$ gold price (in red).
The upshot is that for the first time in more than 5 months the gold market has a ‘fundamental’ tail-wind, which is a prerequisite for a substantial rally. For reasons that I’ve mentioned in TSI commentaries I’m expecting a tradable 2-month rally from a July low rather than a substantial rally, but my expectations will change if the evidence changes.
*Note that I use the word “true” to distinguish the actual fundamental drivers of the gold price from the drivers that are regularly cited by gold-market analysts and commentators. According to many pontificators on the gold market, gold’s fundamentals include the volume of metal flowing into the inventories of gold ETFs, China’s gold imports, the volume of gold being transferred out of the Shanghai Futures Exchange inventory, the amount of “registered” gold at the COMEX, India’s monsoon and wedding seasons, jewellery demand, the amount of gold being bought/sold by various central banks, changes in mine production and scrap supply, and wild guesses regarding JP Morgan’s exposure to gold. These aren’t true fundamental price drivers. At best, they are distractions.