MMT: The theory of how to get something for nothing

March 12, 2019

[This blog post is a modified excerpt from a TSI commentary published about a month ago]

Modern Monetary Theory, or MMT for short, is gaining popularity in the US. It is based on the idea that under the current monetary system the government doesn’t have to borrow. Instead, it simply can print all the money it needs to fill the gap between its spending and its income. The only limitation is “inflation”. As long as “inflation” is not a problem the government can spend — using newly-created money to finance any deficit — as much as required to ensure that almost everyone is gainfully employed and to provide all desired services and infrastructure. It sounds great! Why hasn’t anyone come up with such an effective and easy-to-implement prosperity scheme in the past?

Of course it has been tried in the past. It has been tried countless times over literally thousands of years. The fact is that there is nothing modern about Modern Monetary Theory. It is just another version of the same old attempt to get something for nothing.

Most recently, MMT was put into effect in Venezuela. For all intents and purposes, the government of Venezuela printed whatever money it needed to pay for the extensive ‘free’ social services it promised to the country’s citizens. The MMT apologists undoubtedly would argue that the money-printing experiment didn’t work in Venezuela because the government didn’t pay attention to the “inflation” rate. It kept on printing money at a rapid pace after “inflation” became a problem. Our retort would be: “Great point! Who would have thought that a government with the power to print money couldn’t be trusted to stop printing as soon as an index of prices moved above an arbitrary level.”

In essence, MMT is based on the fiction that the government can facilitate an increase in overall economic well-being by exchanging nothing (money created ‘out of thin air’) for something, or by enabling the recipients of the government’s largesse to exchange nothing for something. It is total nonsense, although there is an obvious reason that it appeals to certain politicians. Its appeal to the political class is that it superficially provides an easy answer to the question that arises when politicians promise widespread access to valuable services free of charge. The question is: “Who will pay?” According to MMT, nobody pays until/unless “inflation” gets too high.

And what happens when inflation gets too high? Well, according to MMT the government simply ramps up direct taxation to reduce the spending power of the private sector, which supposedly quells the upward pressure on prices.

Therefore, MMT can be viewed as a case of heads the government wins, tails the private sector loses. As long as “inflation” is below an arbitrary level the government can extract whatever wealth it wants from the private sector indirectly by printing money, and if “inflation” gets too high the government can extract whatever wealth it wants from the private sector via direct taxation.

The crux of the issue is that new wealth can’t be created by printing money, but existing wealth will be redistributed. It’s like when a private counterfeiter prints new money for himself. When he spends that money he diverts real wealth to himself while contributing nothing to the economy. MMT is the same principle applied on a gigantic scale.

That being said, MMT does have its good points, just not the good points that its proponents claim.

As happens when money is loaned into existence under the current system, the application of MMT will affect relative prices as well as the so-called “general price level”. The reason is that the new money won’t be injected uniformly across the economy. However, it’s likely that the price increases stemming from the monetary inflation will be more uniform and direct under MMT than under the current system. In other words, under MMT the effects of monetary inflation should be reflected much sooner and to a far greater extent in the CPI than is the case with the current system.

That the application of MMT would lead quickly to what most people think of as “inflation” is a benefit, because the link between cause (monetary inflation) and effect (rising prices) would be obvious to almost everyone. A related benefit is that MMT would short-circuit the boom-bust cycle.

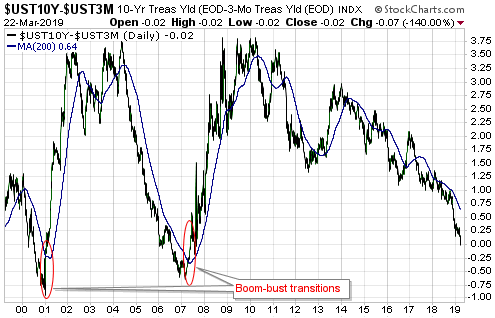
Booms happen when the Fractional Reserve Banking (FRB) system (with or without a central bank) expands credit and in doing so creates the impression that the quantity of real savings is much greater than is actually so. This prompts excessive investment in long-term business ventures that would not look viable in the absence of misleading interest-rate signals.

We assume that under MMT the commercial banks still would be lending new money into existence, but the temporary downward pressure on interest rates from the surreptitious money creation of the banks would be more than offset by the upward pressure on interest rates from the blatant money-printing of the government. The boom phase therefore would be very short, perhaps even barely noticeable. In effect, MMT would bypass the boom and go straight to the bust. Again, this would be beneficial because it would expose the link between cause (the application of a crackpot monetary theory) and effect (economic hardship for most people).

MMT is such an obviously silly idea that any economist, politician, journalist or financial-market commentator who advocates it should not be taken seriously. However, that they are being taken seriously opens up the possibility that MMT will be implemented in the not-too-distant future, with the ‘benefits’ outlined above.

Uranium’s stealth upward trend

March 4, 2019

It’s likely that by the middle of the next decade, most new cars, trucks and buses will be Electric Vehicles (EVs). As a consequence, it’s a good bet that over the next several years the demand for both gasoline and diesel will shrink dramatically while the demand for electricity (to recharge EV batteries) experiences huge growth. Part of this demand growth will be satisfied by nuclear power, which is why uranium is an indirect play on the EV trend.

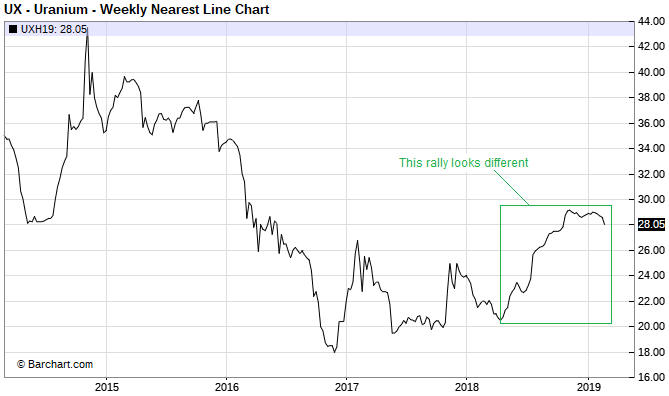
The uranium price might have begun to discount the aforementioned shift in demand in that it has been quietly trending upward since around April of last year (a weekly chart is displayed below). I say “quietly” because the rally has been accompanied by very little in the way of speculative enthusiasm. On the contrary, the rally that began last April has been accompanied by widespread scepticism.

This is an important sentiment change. Whereas every multi-month up-move in the uranium price prior to last year was greeted as if it heralded the beginning of a bull market, almost everyone has dismissed the most recent rally as just another counter-trend bounce. Being bearish on uranium has become easy, but bull markets begin when it’s easy to be bearish.

uranium_040319

I’m not convinced that a uranium bull market is underway, but I do think that for the uranium-mining sector the intermediate-term risk/reward is skewed decisively towards reward. The reason is that the mining stocks could achieve large price gains with or without a genuine bull market in the underlying commodity. All it would take, I think, is a move by the uranium price into the $30s to convince many speculators that a major trend reversal had occurred and prompt aggressive buying of uranium-mining equities.

It used to be that owning shares of the Global X Uranium Fund (URA) was the simplest and surest way of participating in a uranium-mining rally, but that is no longer the case due to the changes that were made to this fund last year. As outlined HERE, during the second quarter of last year the index that URA tracks was changed from the Solactive Global Uranium Total Return Index to the Solactive Global Uranium & Nuclear Components Total Return Index. Thanks to this change, seven of URA’s current top ten holdings have no correlation with the uranium price.

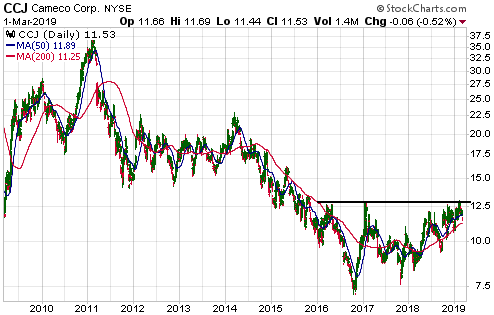
Nowadays, owning the shares of Cameco (CCJ) is the surest way of participating in a uranium-mining rally.

It looks to me like CCJ is not far from completing a 3-year base (see chart below). I like the idea of gradually building up a position on weakness while the basing process continues.

CCJ_040319

What the Fed is doing: perception versus reality

February 26, 2019

[This blog post is an excerpt from a TSI commentary published on 24th February]

Based on the par value of maturing securities on its balance sheet there was scope for the Fed to withdraw as much as $43B from the financial markets on 15th February. A week ago we noted that this ‘liquidity drain’ had no effect on the stock market, possibly because the effect would occur on the next trading day (Tuesday 19th February) or because the Fed chose to withdraw a lot less money than it could have. Now that the Fed has issued its latest weekly balance sheet update we can see why there was no effect from this potential bout of “quantitative tightening” (QT). We can also see that the general perception of what the Fed is doing has deviated in a big way from what the Fed actually is doing.

During the 7-day period from 13th to 20th February the Fed’s securities portfolio fell by $31B. In other words, the Fed implemented $31B of a potential maximum $43B of QT. Over the same period, however, the amount of money in the US federal government’s account at the Fed fell by $44B. This means that there was a $31B withdrawal of liquidity by the Fed in parallel with a $44B injection of liquidity by the government, resulting in a net liquidity ADDITION of $13B. No wonder there wasn’t a noticeable negative effect on the stock market from the Fed’s actions.

The difference between a Fed liquidity injection and a government liquidity injection is that whereas the Fed can inject new money, the government can only recycle existing money (the government returns to the economy the money it previously removed via borrowing or taxation). Government liquidity injections therefore are not inflationary, but their short-term effects can be similar to Fed liquidity injections.

Note that at 20th February the government had about $330B in its account at the Fed. This means that the government currently has the ability to inject up to $330B into the economy, but depending on the size of its desired cash float it may or may not make additional injections in the short-term.

Also note that notwithstanding all of the ‘dovish’ talk that has emanated from the Fed over the past two months, the QT program has continued. From 2nd January to 20th February the Fed removed $63B from the economy as part of its “balance sheet normalisation”. The pace of the liquidity removal is slower than the Fed’s self-imposed $50B/month limit, but it is not correct to say — as some pundits have said — that the Fed has stopped tightening. The Fed is still pulling on the monetary reins.

That the Fed is still tightening means that there is a substantial mismatch at the moment between perception and reality. The general perception is that the Fed is now either on hold or preparing to loosen, but, as mentioned above, this most definitely is not the case. Consequently, bullish speculators in the stock, commodity and gold markets are getting ahead of themselves.

It’s possible that the Fed will end its monetary tightening within the next few months, but that’s only going to happen if there’s another pronounced shift away from risk. To put it another way, the more the markets discount an easing of monetary policy the less chance the easing will occur. In fact, if the stock market extends its upward trend into May-June then the Fed probably will resume its rate-hiking in June.

Gold generally does what it is supposed to do

February 18, 2019

Like every other financial market in world history, the gold market is manipulated. However, anyone who believes that manipulation of the gold market is an important influence on major gold-price trends does not understand the true fundamental drivers of the gold price.

To paraphrase Jim Grant, gold’s market value is the reciprocal of confidence — in the banking system (including the central bank), the economy and the government. In other words, gold should do relatively well when confidence is on the decline and relatively poorly when confidence is on the rise.

By comparing the gold/commodity ratio with measures of monetary and/or economic confidence it can be shown that gold generally does exactly what it should do. There are periods of divergence, but these tend to be short (no more than a few months) and barely noticeable on long-term charts.

The point outlined above can be illustrated by comparing the gold/commodity (gold/GNX) ratio with the IEF/HYG ratio, which I’ve done in the following chart.

The IEF/HYG ratio is fit for our purpose because it is a measure of what’s happening to credit spreads, and because the economy-wide credit-spread trend is one of the best indicators of economic confidence. Specifically, the IEF/HYG ratio increases when credit spreads are widening (indicating declining economic confidence) and decreases when credit spreads are narrowing (indicating rising economic confidence).

Therefore, it is fair to say that the following chart compares the gold/commodity ratio with the reciprocal of confidence in the US economy.

Lo and behold, the two lines on the chart track each other quite closely.

goldGNX_creditsp_180219