A test for China’s propaganda machine

February 17, 2020

[This blog post is a modified excerpt from a recent TSI commentary]

The main purpose of the GDP growth numbers and most other economic statistics reported by China’s government is to tell the story that the central committee of the Communist Party wants to tell. In other words, the economic numbers form part of the State’s propaganda.

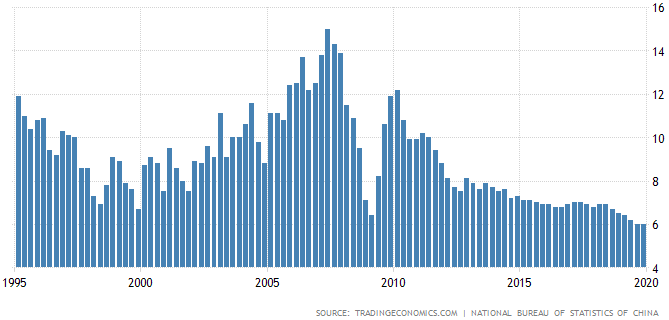
For example, during the first decade of this century the Party’s objective was to show that the economy was performing in spectacular fashion, so the reported GDP growth numbers were almost never below 8% and regularly above 10%. In more recent years the overriding concern has been to paint a picture of stability and sustainable progress, which has involved reporting consistent GDP growth in the 6%-7% range. Refer to the following chart for more detail. Amazingly, most Western analysts accept these figures as if they were accurate reflections of reality, partly, we suspect, because there is no way to prove that what’s being reported is bogus.

Once in a while, however, something happens that shines a light on the meaninglessness of the official numbers. An example was the claim by China’s government that its economy was still growing at an annualised pace of more than 6% during the worst point of the 2007-2009 global recession. Another example very likely will be the quarterly GDP growth that China’s government reports for the first quarter of this year.

The consensus view in the financial news media appears to be that due to the SARS-CoV-2 virus, China’s GDP growth rate in Q1-2020 will slide from 6%+ to ‘only’ 4%-5%. The reality, however, is that China’s economy could not be growing at the moment. Large sections of the country have been essentially put in lock-down mode, and many factories, restaurants, shops and other businesses have been temporarily closed. Tourism has ground to a halt, home sales have collapsed by 90% and vehicle sales are expected to fall by 50%-80% from the same period last year. In some large Chinese cities, including Shanghai, the government has directed state property owners not to collect rent from small- and medium-sized businesses during February and March.

Other examples of the virus’s dampening effect on economic activity are included in articles published on 13th February at the South China Morning (SCMP) and Caixin. According to the SCMP article:

“Recruitment site Zhaopin said this week that around 10 per cent of firms they surveyed were “on the verge of death”, with around 30 per cent planning job cuts and another 30 per cent saying they could not pay their employees on time.”

Along similar lines, the Caixin article notes:

“Even before the outbreak, many small businesses were already grappling with shrinking sales as China’s economy logged some of its slowest growth in decades. With business now at a standstill during the outbreak, many are facing existential liquidity crises. Large numbers say they are having difficulties just paying salaries, adding they can only survive for a matter of months using their current resources, even if Beijing provides support.”

It should be obvious to anyone with at least rudimentary knowledge of the world that China’s economy is contracting right now. Therefore, if the government reports GDP growth of 4%+ for the first quarter of this year it will be a tacit admission that the official numbers are totally fictitious. By the same token, to retain any semblance of credibility China’s government will have to admit that its economy shrank during the first quarter of this year.

That’s why China’s next quarterly GDP number will be a test.

Sometimes it actually is different

February 11, 2020

In a TSI commentary last November I wrote about adjustments I was making to my stock selection process. These adjustments weren’t due to issues with any individual stock(s) or the performance of any individual stock-market sector. In particular, the poor performance of the average junior gold-mining stock during 2019’s gold rally wasn’t the primary driver of my decision to make some changes, although it was the proverbial “last straw”. The primary basis for my adjustment was evidence that the investing landscape had changed in a permanent, or at least a semi-permanent, way.

Long-term changes in the investing landscape happen from time to time, that is, the future is not always a simple extrapolation of the past. This occurs not because of a change in human nature (human nature never changes), but because of a change in the monetary system. For example, the investment strategy that involved shifting from equities to bonds when the stock market’s average dividend yield dropped below the average yield on investment-grade bonds worked without fail for generations prior to the mid-1950s, but from the mid-1950s onward it didn’t work. The reason this ‘fail safe’ approach to asset allocation stopped working was the increasing propensity/ability of central banks to inflate the money supply.

As part of their attempts to encourage more borrowing and consumption, over the past few years the major central banks manipulated interest rates down to unprecedented levels. Ten years ago very few people thought that negative nominal interest rates were possible, but in 2019 we reached the point where 1) a substantial portion of the developed-world’s government debt was trading with a negative yield to maturity, 2) some corporate bonds had negative yields to maturity, and 3) banks in some European countries were offering mortgages with negative interest rates.

Due to the draconian efforts of central banks to promote more spending and borrowing, it’s possible that the public is now effectively ‘tapped out’. This would explain why the quantity of margin debt collapsed over the past 18 months relative to the size of the US stock market, something that NEVER happened before with the S&P500 in a long-term bullish trend and regularly making new all-time highs. Also, it would explain why the average small-cap stock (as represented by the Russell2000) is trading at a 16-year low relative to the average large-cap stock (as represented by the S&P500).

Linked to the relatively poor performance of the average small-cap stock is the increasing popularity of passive investing via indexes and ETFs. Over the past several years there has been a general decline in the amount of active, value-oriented stock selection and a general rise in the use of ETFs. This has caused the stocks that are significant components of popular ETFs to outperform the stocks that are not subject to meaningful ETF-related demand, regardless of relative value. There is no reason to expect this trend to end anytime soon. On the contrary, the general shift away from individual stock selection and towards the use of ETFs appears to be accelerating.

At this stage I’m not making dramatic changes to my stock selection approach. I will continue to follow speculative small-cap stocks, but my selection process will be more risk averse and I will reduce the potential tracking error during intermediate-term rallies in mining stocks by putting more emphasis on ETFs and mutual funds. Also, when making future speculative mining-stock selections I will pay greater heed to the attractiveness of the assets to large mining companies. The reason is that regardless of the public’s willingness to speculate, large mining companies will always be under pressure to replace their depleted reserves and add new reserves. The easiest way for large companies to do this is to buy small companies that have discovered mineral deposits of sufficient size and quality.

In summary, as a result of unprecedented manipulation of money and interest rates it’s possible that some of the investing/speculating strategies that worked reliably in the past will not work for the foreseeable future. I think it makes sense to adapt accordingly.

Does a correction need a fundamental catalyst?

January 28, 2020

[This blog post is an excerpt from a TSI commentary published on 26th January 2020]

Given the extent to which the US stock market is stretched in both momentum and sentiment terms, there doesn’t have to be a news-related catalyst for a significant correction. However, the mainstream financial press tries to link every move in the stock market to the current news. If a correction began last week or gets underway this week it’s likely that many fingers of blame will point to the Wuhan virus.

The situation is ‘fluid’, but at last count 13 Chinese cities had been placed under full or partial lockdown in an effort to prevent the virus from spreading. Furthermore, the number of countries with confirmed cases of the virus is growing.

In terms of global economic impact we think that the Wuhan virus will prove to be a minor issue, but if the number of confirmed cases continues to rise then many market participants could sell first and ask questions later. Based on what happened with similar viruses in the past, the number of confirmed cases might not peak until March.

Blame for a correction also could be directed towards the Fed, largely due to a misunderstanding of the Fed’s “repo market” operations.

The net amount of ‘liquidity’ provided by the Fed to the repo market has declined over the past couple of weeks, but not because the Fed has stopped supporting this market. The money provided to the repo market is a very short-term loan that often matures within one day, so the amount of repo money provided by the Fed will reduce over time unless the Fed adds new money (makes new loans) at a rapid pace. For example, the Fed ‘pumped’ (loaned) $74 billion into the repo market last Thursday, but there was a net decline of $10 billion on the day due to the expiration of $84 billion of previous loans.

Also worth mentioning is that the amount of money provided by the Fed to the repo market cannot exceed the demand for short-term loans in this market.

We assume that the Fed intends to withdraw from the repo market over the coming months, with the very short-term money it provides via this market steadily being replaced by the semi-permanent money it adds via the asset monetisation program — the program that we aren’t supposed to call QE, even though it is mechanically identical to QE — introduced last October. If this happens it will result in a large decline in the “Repurchase Agreements” line on the Fed’s balance sheet and could result in a small decline in the total size of the Fed’s balance sheet, but it won’t be a sign that the Fed is tightening or even becoming less easy.

To further explain, note that even though many commentators lump the Fed’s repo market support program together with the Fed’s asset monetisation program to arrive at a total amount of new Fed-generated monetary inflation, the two programs are very different and should not be combined. The reason is that despite “repo” being short for repurchase, repo operations do not involve asset purchases per se. When the Fed does a “repo” it lends money (that it creates out of nothing) to a borrower and receives collateral, usually in the form of a Treasury security or a Mortgage-Backed Security (MBS), to secure the loan. When the loan is repaid, which happens one or fourteen days later depending on whether it’s an overnight loan or a term loan, the money is returned to the Fed (and is immediately extinguished) and the collateral is returned to the borrower.

Any monetary inflation caused by the Fed’s repo operations is therefore self-extinguishing within a very short time (1-14 days). However, monetary inflation caused by the Fed’s asset monetisation program could be permanent. The reason is that although the debt securities (T-Bills) purchased by the Fed with new money will mature within a few months, the Fed has said that it will re-invest (rather than extinguish) the proceeds received when the securities mature.

The upshot is that even if the total size of the Fed’s balance sheet reduces as the repo support program winds down, as long as the Fed is adding ‘permanent’ money via its asset monetisation program it is acting in an inflationary manner. Consequently, it will not be reasonable to blame a near-term stock market downturn on the Fed becoming tighter or less easy.

Just to be clear, the Fed is at least partly responsible for the fact that the stock market rose in a virtual straight line from mid-October through to 23rd January. However, the Fed is not responsible for the market pulling back from an overbought/overbullish extreme.

The crux of the matter is that regardless of the fundamentals, large and liquid markets don’t go up or down in straight lines for long. There are always corrections. Surely we don’t have to rack our brains in an effort to come up with a fundamental reason for a correction when some short-term sentiment and momentum indicators are stretched to historic extremes. It’s more of a challenge to explain why a correction didn’t happen sooner.

Do gold mining stocks lead gold?

January 21, 2020

Do gold mining stocks, as represented by the Barrons Gold Mining Index (BGMI) or the XAU or the HUI, lead gold bullion at significant turning points? According to many analysts the answer is a resounding “yes”. However, according to the historical record the answer is “sometimes, but not consistently”. I’ll go with the historical record.

There are plenty of examples of gold mining stocks leading the bullion price at a turning point from down to up or up to down, but there are at least as many examples of gold mining stocks lagging the bullion at a turning point. The most blatant example of the latter occurred in 1980. It is well known that gold bullion reached a long-term price top in January-1980, but it is less well known that gold mining stocks, as represented on the following weekly chart by the BGMI, experienced a huge rally after the major high in the gold price and didn’t reach a long-term peak of their own until September-1980.

BGMI_1980_200120

Another example of gold bullion leading the gold-mining sector at a meaningful turning point occurred during the mid-1980s. First, gold bullion reached a multi-year bottom in February-1985, but it wasn’t until July-1986 that the XAU reached a similar bottom. Second, the XAU commenced an intermediate-term rally in late-July of 1986, but as noted on the following daily chart the associated bottom in the gold price occurred about 6 weeks earlier.

XAU_1986_200120

Here are examples of the same lead-lag relationship from the more recent past:

1) Gold bottomed on a long-term basis in early-December of 2015, but the equivalent low for the HUI didn’t occur until mid-January of 2016. Gold then reached an intermediate-term top in July-2016, but the associated top for the HUI wasn’t put in place until about a month later. In other words, the gold-mining sector lagged the bullion market at both the start and the end of the 2016 intermediate-term rally.

HUI_2016_200120

2) Gold made an intermediate-term bottom in August-2018, whereas the HUI waited until September-2018 to make an intermediate-term bottom of its own. Then, in May of 2019 the HUI made a sequence of lower correction lows while gold bullion remained above the low it made at the beginning of the month.

HUI_2018_200120

In my experience, rather than labour under the unreliable assumption that gold stocks lead the bullion at turning points, any divergence or non-confirmation between gold stocks and gold bullion should be viewed as potentially bullish after prices have become stretched to the downside and potentially bearish after prices have become stretched to the upside. For example, after prices have been trending downward for several months, a new multi-month low in the gold price that isn’t quickly confirmed by the HUI or a new multi-month low in the HUI that isn’t quickly confirmed by the gold price should be viewed as a bullish sign. By the same token, after prices have been trending upward for several months, a new multi-month high in the gold price that isn’t quickly confirmed by the HUI or a new multi-month high in the HUI that isn’t quickly confirmed by the gold price should be viewed as a bearish sign.

To put it more simply, non-confirmations between the gold price and the related mining indices matter, but it doesn’t matter whether the non-confirmations involve relative strength or relative weakness in the mining sector.