[This blog post is an excerpt from a recent TSI commentary]
During a gold bull market the “true fundamentals”, as indicated by our Gold True Fundamentals Model (GTFM), will be bullish most of the time. However, even during a bear market there can be periods of a year or longer when the fundamental backdrop is bullish most of the time. This means that the GTFM can’t be used to determine whether gold’s long-term trend is bullish or bearish. The historical sample size is small, but the most important prerequisite for the start of a gold bull market appears to be the start of a bear market in US equities.
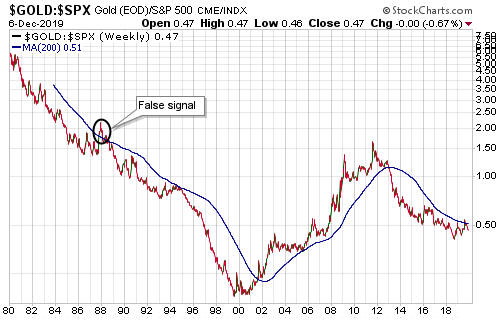
That’s why we use a long-term weekly chart of the gold/SPX ratio with a 200-week MA to identify gold bull and bear markets. Unfortunately, at this time the chart (see below) is noncommittal, because gold/SPX bottomed in August of 2018 but is yet to make a sustained break above its 200-week MA. It’s possible that a gold bull market got underway in August of last year, but it’s also possible that we are dealing with a 1-2 year up-swing within a bear market.
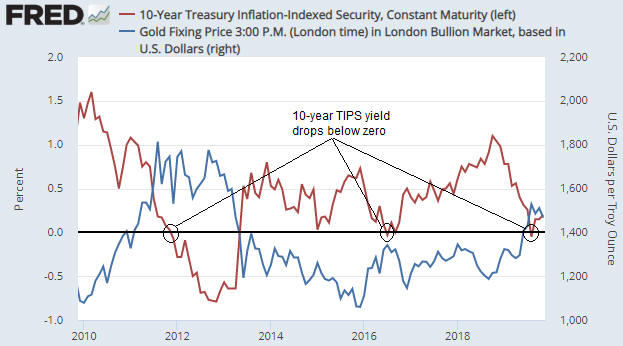
The inverse long-term relationship between gold and the US stock market is not always evident over the short-term or even the intermediate-term, although over the past two years it does seem like the gold market and the stock market have been taking turns. This is illustrated by the following chart. The chart shows that there was a net gain in the SPX over the periods when gold trended downward and a net loss in the SPX over the periods when gold trended upward.
The implication is that gold’s next 3-month+ upward trend should unfold over a period in which the SPX generates a poor return (most likely a significant loss).