Signalling a boom-to-bust transition

August 16, 2021

[This post is an excerpt from a recent report published at TSI]

There are two things that always happen at or prior to the start of a boom-to-bust transition* for the US economy. One is a clear-cut widening of credit spreads. The other is pronounced weakness in the Industrial Metals Index (GYX) relative to the gold price. These indicators have been known to generate false positives, meaning that there have been times when they have warned incorrectly that a bust was about to begin. However, as far as we can tell they have never generated a false negative, that is, they have never failed to signal an actual boom-to-bust transition in a timely manner.

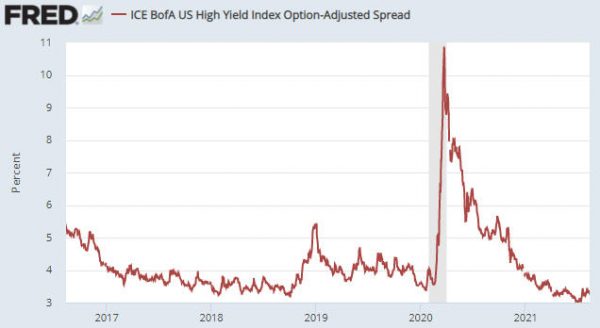
There are many different credit-spread indicators. We use three, one of which is the US High Yield Index Option-Adjusted Spread (HYIOAS). As illustrated below, over the past month this indicator has risen slightly from a 10-year low. This means that credit spreads in the US are close to their narrowest levels of the past ten years.

After the HYIOAS has dropped well below 4%, a reversal is signalled by the index making a higher short-term high AND moving back above 4%. At the moment, the first of these criteria would be triggered by a move above 3.5%.

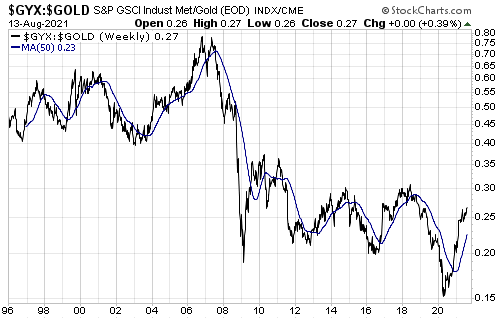
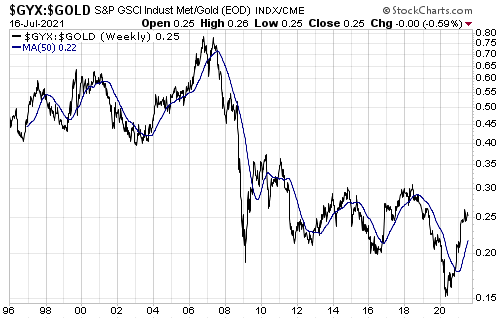
Turning to the second of the reliable boom-bust indicators mentioned above, displayed below is a weekly chart of the GYX/gold ratio. To generate a boom-to-bust warning the line on this chart would have to reverse downward and move below its 50-week moving average. Given that it made a new 2-year high last week it is a long way from doing this.

Summing up, neither of the indicators that in the past have always warned prior to the start of a boom-to-bust transition for the US economy is currently close to triggering. However, within a boom there will be ebbs and flows in economic growth and confidence. Economic growth and confidence have declined a little over the past two months and it’s possible that the decline will become more pronounced over the coming two months, all within the context of a boom that currently shows no signs of ending.

*A boom is defined as a period lasting 2-3 years or longer during which monetary inflation creates the illusion of robust economic progress. A bust is a period usually lasting 1-3 years during which the mal-investments of the boom are liquidated, leading to general economic hardship. Bust periods sometimes, but not always, contain official recessions.

The monetary inflation crash continues

August 3, 2021

[This blog post is an excerpt from a report recently published at TSI]

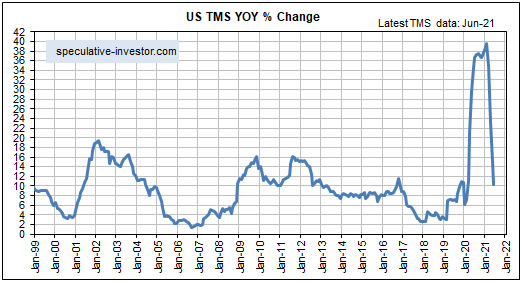
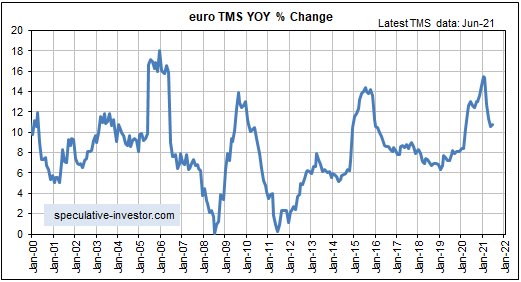
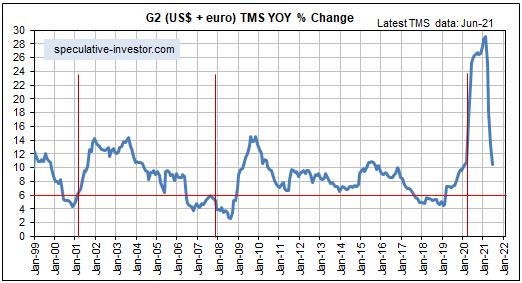
The spectacular rise in the money supply growth rate that began in March of last year predictably led to an equally spectacular decline after the effects of the central banking world’s initial frenzied response to the ‘coronacrisis’ dropped out of the year-over-year calculations. Displayed below are charts showing the spectacular declines over the past few months in the monetary inflation rates of the US, the euro-zone and the G2 (the US plus the euro-zone).

Note that the steep declines probably will continue for one more month, after which the year-over-year growth rates should level out. Also note that the vertical red lines on the G2 monetary inflation chart indicate the starting times of US recessions.

As mentioned in previous TSI commentaries, the monetary backdrop will stop being supportive for the US stock market after the annual TMS growth rate drops below 6%. This could happen as soon as the first quarter of next year, but a lot will depend on commercial bank lending. For example, if commercial banks ramp-up their lending then the US monetary inflation rate could stay in the 7%-10% range for a long time even if the Fed ‘tapers’. Something along these lines happened during 2014-2016.

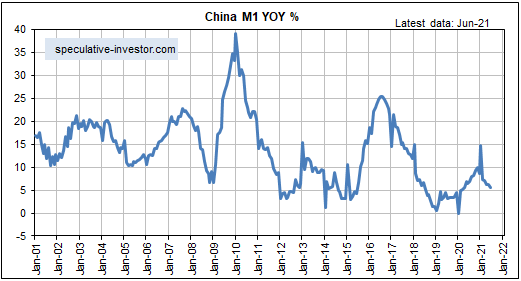
The monetary situation in China is very different. As illustrated by the following chart, the year-over-year growth rate of China’s M1 money supply is close to a multi-decade low.

All else remaining the same, the relatively small amount of monetary inflation in China over the past 16 months would pave the way for China’s economy to be relatively strong over the next few years. However, all else isn’t remaining the same, in that the Communist Party of China (that is, Xi Jinping) is becoming increasingly dictatorial and heavy-handed in its dealings with the private sector.

We’ve written previously that the H1-2021 global monetary inflation reversal probably won’t be a major driver of prices over the balance of this year. This is due to the time it takes for a change in the money-supply growth trend to ‘ripple through’ the financial markets and the economy. However, unless the Fed and the ECB generate a new monetary tsunami over the next several months, the G2 monetary inflation rate could become low enough by early next year to set off a boom-to-bust transition.

No boom-to-bust transition, yet

July 20, 2021

[This is a modified excerpt from a commentary published at TSI on 18th July 2021]

One of the most useful intermediate-term indicators of the financial/economic landscape is the performance of industrial metals relative to gold as indicated by the GYX/gold ratio. This ratio turns down prior to financial crises and major economic slowdowns and turns up in the early stages of recoveries. It occasionally makes a ‘head fake’ move, but over the 25 years of its history it has never failed to reverse course in a timely manner.

With reference to the following weekly chart, we define “reverse course” to mean cross from above to below or below to above the 50-week MA (the blue line). For example, GYX/gold turned down ahead of the 1998 Russian/LTCM crisis, the 2001-2002 recession and equity bear market, the 2007-2009 Global Financial Crisis, the 2011-2012 European debt crisis, the 2015 Yuan-devaluation panic, and the Q4-2018 stock market panic that forced the Fed to do an about-face. Note that after turning down ahead of the Q4-2018 panic it didn’t turn back up until the great reflation trade got underway in Q2-2020.

As an aside, ratios that use gold would not be such reliable indicators of important economic and financial-market trends if the gold price were distorted in a big way by manipulation.

Currently there are signs in the equity, bond, commodity and currency markets that a shift away from risk is underway. These signs actually began to appear in March and became more pronounced over the past few weeks. For example, we have been fixating on the ratio of the Russell2000 Small-Cap ETF (IWM) to the S&P500 Large-Cap ETF (SPY), which peaked in March and broke out to the downside early this month. With the early-July downside breakout, this indicator changed from a ‘yellow flag’ to a ‘red flag’ as far as the stock market’s short-term prospects were concerned.

However, there is no evidence in the performance of the GYX/gold ratio that we are dealing with anything more serious than corrections to the major trends that got underway during the second quarter of last year. At least, there isn’t yet.

It’s possible that such evidence will emerge over the months ahead, so we must pay attention to new data and not blindly assume that the future will be a simple extrapolation of the past.

When will rising interest rates become a major problem for the stock market?

July 5, 2021

We asked and answered the above trick question in a blog post on 22nd March. It’s a trick question because although rising interest rates put downward pressure on some stock market sectors during some periods, they are never the primary cause of major, broad-based stock market declines. After all, the secular equity bull market that began in the early-to-mid 1940s and ended in the mid-to-late 1960s unfolded in parallel with a rising interest-rate trend, and the preceding secular equity bear market unfolded in parallel with a declining interest-rate trend.

As explained in the above-linked post from March-2021, when assessing the prospects of the stock market we should be more concerned about monetary conditions than interest rates. The reason, in a nutshell, is that it isn’t always the case that rising interest rates indicate tightening monetary conditions or that falling interest rates indicate loosening monetary conditions. For example, there was a substantial tightening of monetary conditions in parallel with falling interest rates during 2007-2008.

When attempting to determine the extent to which monetary conditions are tight or loose, one of the most important indicators is the growth rate of the money supply itself.

Rapidly inflating the money supply leads to a period of unsustainable economic vigour called a boom, while a subsequent slowing of the monetary inflation rate leads to a transition from boom to bust. Furthermore, once a boom has been set in motion a subsequent unravelling that eliminates all or most of the superficial progress becomes inevitable. The unravelling can be delayed by maintaining a fast pace of money-supply growth, but doing so will have the effect of making the eventual bust more severe.

Over the past 25 years, booms have begun to unravel within 12 months of the year-over-year growth rate of G2 (US plus eurozone) True Money Supply (TMS) dropping below 6%. In the typical sequence there is a decline in the G2 monetary inflation rate to below 6%, followed within 12 months by the start of an economic bust (the unravelling of the monetary-inflation-fuelled boom), followed within 12 months by an official recession. Usually, the broad stock market begins to struggle from the time the boom starts to unravel, that is, from the time the G2 monetary inflation rate drops below 6%.

In the above-linked post from March-2021, we concluded:

“…it’s likely that the unravelling of the current boom will begin with the monetary inflation rate at a higher level than in the past. However, with the G2 TMS growth rate well into all-time high territory and still trending upward it is too soon (to put it mildly) to start preparing for an equity bear market.”

It is still too soon to start preparing for an equity bear market (as opposed to a significant correction, which may well be on the cards), but the following chart of the G2 TMS growth rate shows that there has been a dramatic change over the past few months. Based on what has happened and what probably will happen on the monetary front, the conditions could be ripe for the next boom-to-bust transition to begin during the first half of next year.

G2TMS_060721