
[This post is an excerpt from a recent report published at TSI]
There are two things that always happen at or prior to the start of a boom-to-bust transition* for the US economy. One is a clear-cut widening of credit spreads. The other is pronounced weakness in the Industrial Metals Index (GYX) relative to the gold price. These indicators have been known to generate false positives, meaning that there have been times when they have warned incorrectly that a bust was about to begin. However, as far as we can tell they have never generated a false negative, that is, they have never failed to signal an actual boom-to-bust transition in a timely manner.
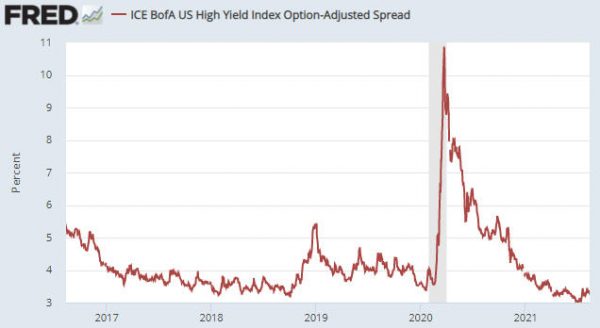
There are many different credit-spread indicators. We use three, one of which is the US High Yield Index Option-Adjusted Spread (HYIOAS). As illustrated below, over the past month this indicator has risen slightly from a 10-year low. This means that credit spreads in the US are close to their narrowest levels of the past ten years.
After the HYIOAS has dropped well below 4%, a reversal is signalled by the index making a higher short-term high AND moving back above 4%. At the moment, the first of these criteria would be triggered by a move above 3.5%.
Turning to the second of the reliable boom-bust indicators mentioned above, displayed below is a weekly chart of the GYX/gold ratio. To generate a boom-to-bust warning the line on this chart would have to reverse downward and move below its 50-week moving average. Given that it made a new 2-year high last week it is a long way from doing this.
Summing up, neither of the indicators that in the past have always warned prior to the start of a boom-to-bust transition for the US economy is currently close to triggering. However, within a boom there will be ebbs and flows in economic growth and confidence. Economic growth and confidence have declined a little over the past two months and it’s possible that the decline will become more pronounced over the coming two months, all within the context of a boom that currently shows no signs of ending.
*A boom is defined as a period lasting 2-3 years or longer during which monetary inflation creates the illusion of robust economic progress. A bust is a period usually lasting 1-3 years during which the mal-investments of the boom are liquidated, leading to general economic hardship. Bust periods sometimes, but not always, contain official recessions.