Money supply confirms the bust

August 31, 2022

[This blog post is an excerpt from a commentary published at TSI last week]

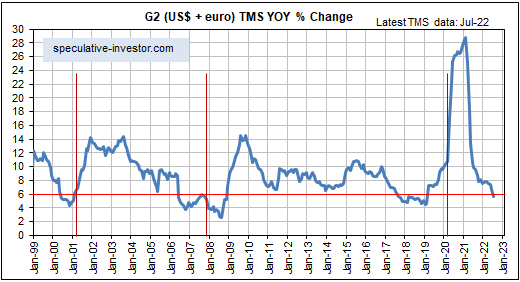
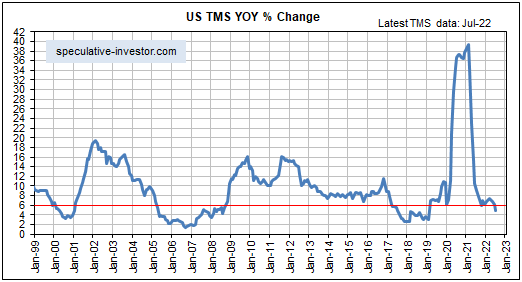
We have referred to the 6% level for the year-over-year US True Money Supply (TMS) growth rate (the US monetary inflation rate) as the boom-bust threshold, because transitions from economic boom to economic bust generally don’t begin until after the TMS growth rate has made a sustained move below this level. It was different this time, however, because according to other indicators the US economy entered the bust phase of the monetary-inflation-driven boom-bust cycle during the first quarter of this year with the TMS growth rate still above 6%. Why was it different this time and what’s the current situation?

We outlined the most likely reasons why it was different this time in previous commentaries, most recently in the 27th July Interim Update. Here’s the relevant excerpt from our 27th July commentary:

“We think that the current bust began at a higher rate of monetary inflation than in the past for two main reasons. The first is that the Fed was still in monetary-loosening mode at the peak of the economic boom. This had never happened before and resulted in even greater wastage of real savings/resources than in previous booms. The second reason is that due to decades of increasing central bank manipulation of money and interest rates, the economy has become structurally weaker and therefore the collapse of a boom now requires less relative monetary tightening than in the past.”

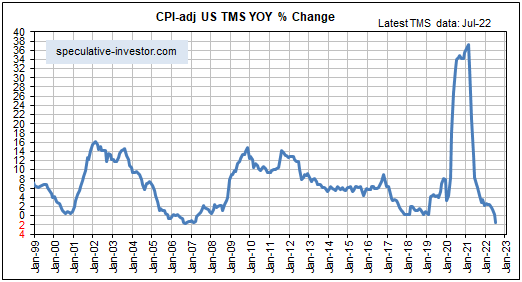
The main new point we want to make today is that the US money-supply data for July-2022, which were published on Tuesday of this week, reveal that the monetary inflation rate has now confirmed the bust by moving well below the 6% boom-bust threshold. This is illustrated by the first of the two monthly charts displayed below. Furthermore, the second of the following charts shows that the year-over-year TMS growth rate minus the year-over-year percentage change in the Median CPI*, an indicator of the real (inflation-adjusted) change in the US monetary inflation rate, has plunged to near a multi-decade low.

As an aside, from the end of last year to the end of July this year the US True Money Supply increased by $580B. This figure comprises the change in currency in circulation, the change in commercial bank demand and savings deposits, and the change in the amount of money held by the US government in the Treasury General Account (TGA) at the Fed. It is very roughly equal to the increase in commercial bank credit plus the increase in Federal Reserve credit minus the increase in the Fed’s Reverse Repo program. Over the aforementioned period the Fed’s direct actions REDUCED the US money supply by about $210B, but the Fed’s actions were more than offset by the money-creating actions of the commercial banking industry.

With the Fed still on the tightening path, it’s unlikely that the lines on the above charts have bottomed. One implication is that the yield curve probably will become more inverted over the next few months. Another implication is that it would be difficult to be too bearish with regard to the US stock market’s 6-12 month prospects.

*A price index calculated by the Cleveland Fed

Monetary Headwinds

August 17, 2022

[This blog post is a brief excerpt from a recent TSI commentary]

Over the past few weeks the financial markets have celebrated the signs of declining “inflation”, the thinking being that the evidence of an inflation reversal will lead to a Fed pivot in the short-term. This line of thinking is wrong in two critical ways.

The first way it is wrong is that the Fed’s leadership appears to have its eyes firmly fixed on the rear-view mirror. Although there is now a CPI downtick in the rear-view mirror, base effects (the CPI increases that will remain in the year-over-year calculations for months to come) ensure that the headline CPI growth numbers will remain elevated for at least the remainder of this year. For example, even though inflation most likely has peaked on an intermediate-term basis, the numbers that will stay in and drop out of the year-over-year calculations each month mean that there is almost no chance of the year-over-year CPI growth rate dropping below 6% sooner than the first quarter of next year. In fact, the year-over-year CPI growth rate reported for each of the next three months probably will still have an ‘8 handle’.

Therefore, for months to come the Fed is going to be seeing annual CPI growth rates near multi-decade highs, which will encourage it to continue tightening.

The second way it is wrong is that even after the Fed’s leadership starts to feel confident that inflation is heading towards a level that it deems acceptable, there won’t be an immediate policy reversal. Instead, the following sequence is likely:

1) The pace of rate hiking will slow

2) The rate hiking will stop

3) The balance sheet contraction (QT) will stop

4) Rate cutting will begin

5) Balance sheet expansion (QE) will begin

At the moment Step 5 is probably at least eight months into the future. In the 2007-2009 bear market and recession, the bear market didn’t end until about six months AFTER step 5.

This suggests to us that asset prices in general and the stock market in particular will face monetary headwinds until at least the first quarter of next year, and that monetary conditions will not be ripe for a new equity bull market any sooner than the second half of next year. In the meantime there will be rebounds to lower highs followed by declines to lower lows.

The “inflating away the debt” myth

July 27, 2022

[This blog post is an excerpt from a recent commentary published at TSI]

It is claimed that government indebtedness can be reduced via something called “financial repression”, which is the combination of “price inflation” and interest rate suppression. The idea is that the government debt burden can be made smaller in real terms in a relatively painless way by depreciating the currency in which the debt is denominated while the central bank prevents a large rise in the cost of servicing the debt. At a superficial level it seems plausible and may well be attempted over the years ahead by some governments, including the US government. However, aside from it having never worked as advertised in the past, the problem with financial repression is that when viewed through the lens of good economic theory it is not plausible. On the contrary, good economic theory indicates that the financial repression path leads to the destruction of the currency and economic collapse.

To support their argument, advocates of the idea that financial repression can achieve its intended goal (a reduction in the real government debt burden without dramatically adverse economic consequences) point to the US experience during the decade following the end of the Second World War. During this period there was significant “inflation”, a large reduction in federal government indebtedness and a successful effort by the Fed to prevent the yield on US government bonds from rising to reflect the inflation. However, this is an example of the logical error of observing that ‘B’ followed ‘A’ and concluding that ‘A’ must therefore have caused ‘B’.

In economics there are always many potential influences on an outcome. As a result, to avoid coming up with nonsensical cause-effect relationships you must be armed with prior knowledge in the form of good theory. For example, an observation that over the past twenty years the US unemployment rate has tended to move inversely, with a lag, to the price of beer in Iceland, should not lead to the conclusion that the rate of US unemployment could be reduced by increasing the price of beer in Iceland.

With regard to the US post-War experience, the key to success was not “financial repression”. The keys were the dismantling of New Deal programs, the general freeing-up of the economy, a reduction in government spending (government spending collapsed in the two years immediately after the War and then essentially flat-lined for a few years), and a currency linked to the world’s largest gold reserve. It was the combination of economic strength and restrained government spending, not the combination of inflation and interest-rate suppression, that enabled the US government to greatly reduce its debt burden.

In today’s world, we can safely assume that a general freeing-up of the economy leading to strong real growth is not on the cards.

To envisage what would happen in response to financial repression over the years ahead, bear in mind that if the central bank stops one pressure valve from working then the pressure will blow out somewhere else. For example, by monetising enough government debt the Fed could create a situation involving high price inflation and a low interest expense for the US government, but even in the unlikely event that the US government tried to its rein-in its spending the non-interest-related cost of running the government would surge due to price inflation. As a result, the total amount of government debt would rise rapidly and the Fed would be forced to ramp-up its bond monetisation to keep a lid on government bond yields, causing more “inflation” and giving another substantial boost to the cost of running the government, and so on.

Summing up, in a high-inflation low-growth environment, financial repression would lead to a downward spiral in currency purchasing power and an upward spiral in government indebtedness.

Monetary Inflation and Asset Prices

July 7, 2022

[This blog post is an excerpt from a recent TSI commentary]

A basic and very important fact of which hardly anyone is aware is that a general rise in asset prices has nothing to do with economic progress. It is, instead, driven totally by an increase in the supply of money. To put it another way, the general appreciation of asset prices is driven totally by the depreciation of money.

For example, there is no reason other than an increase in the money supply for broad stock market indices to rise over the long-term. The prices of some stocks would rise due to certain companies gaining an advantage and becoming more valuable relative to other companies, but the overall market would not rise in the absence of monetary inflation. An implication is that if the money supply were stable then dividends would constitute 100% of the long-term returns on investment achieved by the owners of broad index funds.

For another example, there is no reason other than an increase in the money supply that residential property prices should rise over the long-term. The prices of some houses would rise due to renovations or zoning changes or some locations increasing in relative popularity, but the median house price would not increase over the long-term in the absence of monetary inflation. In other words, the increase in the median house price is solely due to monetary inflation. This means that if the market value of your house gained 25% over a period and the median house price gained 20% over the same period, then 80% of the increase in the market value of your house was due to the depreciation of money.

A source of confusion is that over the past 50 years asset prices have tended to rise much faster than the prices of goods and services, creating the impression that the price increases are mostly real (that is, not driven by the depreciation of money). This has happened due to the nature of monetary inflation and policies designed to boost the prices of assets.

An important characteristic of monetary inflation is that the new money does not get injected uniformly throughout the economy and therefore does not affect prices in a uniform manner. As explained in a TSI commentary in 2019, this is one of the three reasons that the Quantity Theory of Money (QTM), which holds that the change in the “general price level” is proportional to the change in the money supply, doesn’t work.

Instead of a uniform rise in prices in response to monetary inflation, different prices get affected in different ways at different times depending on who the first receivers of the new money happen to be. In the case where the new money is created by the central bank as part of a QE program, which has happened a lot since 2008, the first receivers of the new money are bond speculators. This makes the owners of financial assets the initial and main beneficiaries of the money creation. In the case where the new money is loaned into existence by commercial banks, the main beneficiaries are the owners of assets that are purchased with the borrowed money. Over the past few decades a sizable portion of the borrowing from commercial banks has been related to the purchase of real estate (most buyers of houses are able to borrow a high percentage of the purchase price), causing the owners of houses to be among the main beneficiaries.

As an aside, monetary inflation is responsible for the widening of the “wealth gap” that has occurred over the past 40 years, because it benefits the asset rich at the expense of the asset poor. The expanding wealth gap is now being touted as the justification for greater government intervention and/or taxation, almost always by people with no understanding of the underlying cause.

As another aside, the big inflation-related change that happened during 2020-2021 is that a large increase in the money supply was accompanied by government actions that simultaneously destroyed supply chains and super-charged consumer spending.

Monetary inflation’s pivotal role in boosting/distorting asset prices is why we pay so much attention to it and so little attention to the more popular ‘fundamentals’. In some cases the more popular fundamentals, market-wide corporate earnings being a good example, are themselves just functions of the monetary inflation rate.