[This blog post is a modified excerpt from a commentary published at TSI in April of 2022. The main changes are updates to the chart and the numbers.]
The US monetary tightening commenced in February of 2021– the month that the US monetary inflation rate peaked at the extraordinary level of 40%. The monetary inflation rate has since collapsed to around 0% and if the Fed has its way will fall even further over the months ahead. Why is this important?
The overarching reason it’s important is that changes in the monetary inflation rate, that is, changes in the rate at which new money is created out of nothing, drive the economy’s boom-bust cycle. More specifically, large increases in the monetary inflation rate result in periods during which the economy is superficially strong and optimism abounds (the boom phase), while subsequent reductions in the monetary inflation rate lay bare the ill-conceived boom-time investments and usher in the bust phase.
Associated with the major trends in the monetary inflation rate that drive the boom-bust cycle are major trends in the yield curve.
A discussion of the relationship between the monetary inflation rate and the yield curve, including a full explanation of why an inversion of the yield curve has preceded all US recessions of the past sixty years, can be found HERE. The bottom line is that trends in the monetary inflation rate drive trends in the yield curve, with a yield curve inversion being caused by a decline in the monetary inflation rate from a high level to a low level. That is, both a flattening of the yield curve to the point where it becomes inverted and a shift in the economy from boom to bust are eventual effects of a downward trend in the monetary inflation rate.
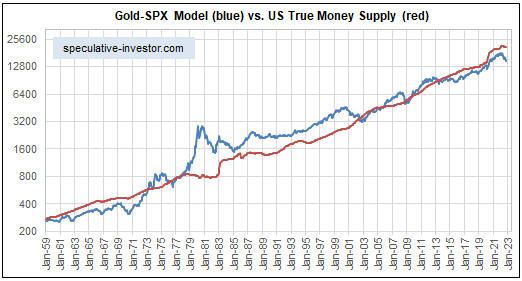
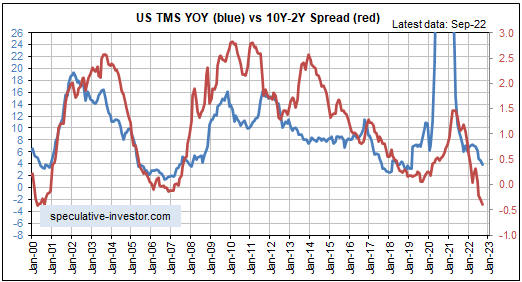
The strong positive correlation between the US monetary inflation rate and the US yield curve is illustrated by the following monthly chart. On this chart the yield curve is represented by the monthly average of the 10year-2year yield-spread and is shown in red. The monetary inflation rate is the year-over-year percentage change in True Money Supply (TMS) and is shown in blue.
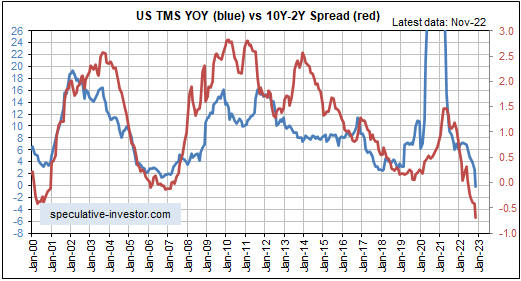
One difference between the current cycle and previous cycles is that monetary conditions in the current cycle became sufficiently tight to drive parts of the yield curve into inverted territory when the Fed was just STARTING a monetary tightening campaign.
Does the Fed have any idea what it is doing?
Before answering the above question it is worth reiterating that the Fed is a Keynesian institution. Within the Keynesian framework the economy can be viewed as a bathtub filled with an amorphous liquid called “aggregate demand”, and it is the job of the central bank and the government to add or remove liquid to keep the level of the tub in a range deemed desirable. In the real world, however, there are millions of individuals making production, consumption and investment decisions for myriads of reasons. Consequently, in the real world there is no such thing as the Keynesian “aggregate demand” and it is ridiculous to view the economy as a bathtub that can be filled/emptied by policymakers to optimise performance.
Returning to the above question, the Fed seems to believe that it can make up for the recklessness of its actions during 2020-2021 by becoming excessively ‘tight’ during 2022-2023. At least, that’s the only plausible explanation for why it started reducing its balance sheet by up to US$95B per month, thus removing up to $95B of money from the economy every month, after the monetary inflation rate had already dropped far enough to bring on the bust phase of the cycle.
Also, the Fed seems to believe that it can address rapidly rising prices resulting from supply shortages by engineering a further tightening of monetary conditions, as if reducing the availability of money will remove the constraints on supply caused by COVID-related policies and anti-Russia sanctions.
The reality is that after an inflation problem has been created via a large increase in the money supply, removing money from the economy cannot help. Actually, it will lead to additional distortions of relative price signals and thus greater economic weakness. What’s desirable is money-supply stability.
So, the answer to the question is no. Even taking into account the limitations imposed by the fatally flawed Keynesian framework in which it operates, the Fed appears to have no idea what it is doing.