
[This blog post is a brief excerpt from a commentary published at speculative-investor.com last week]
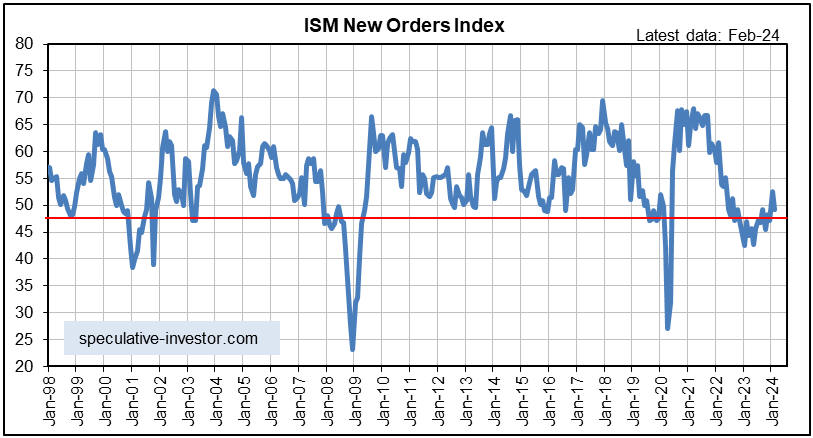
The combination of the ISM Manufacturing New Orders Index (NOI) and the yield curve, our two favourite high-frequency leading indicators of US recession, has been warning of imminent recession since September-2023. Clearly, the warning has not been timely in that no recession has materialised yet. Furthermore, a month ago we noted that while the message of the yield curve was unchanged, the NOI had just risen by enough to move well above its recession demarcation level of 48. Although this did not cancel its recession warning (it would have to move above 55 to do so), January’s rise to 52.5 was unexpected. Have subsequent data provided useful new clues?
The answer is yes and no. The following monthly chart shows that the NOI turned back down in February, meaning that its recession warning is intact. At the same time, the SPX made a new all-time high as recently as Monday 4th March. As previously advised, it would be unprecedented for the SPX to make a new 52-week high AFTER the official recession start time.
This means that recession warnings remain in place, but the earliest time for the start of a recession has been pushed out again. Specifically, the March-2024 new high for the SPX suggests that a recession will not start any sooner than May-2024.
By our reckoning, during the first half of 2022 the US economy entered the bust phase of the economic boom-bust cycle caused by monetary inflation (rapid monetary inflation causes a boom that inevitably is followed by a bust as the receding monetary tide exposes the boom-time mal-investments). The bust phase almost always culminates in a recession, although it doesn’t have to.
So far, the performances of commodity prices in both US$ terms and gold terms are consistent with an economy in the bust phase, in that the GSCI Spot Commodity Index (GNX) made a 2-year low in US$ terms in December-2023 and currently is near a 3-year low in gold terms. The following daily chart shows GNX in gold terms. What’s not consistent with the bust phase are credit spreads, which have returned to their boom-time levels. Note that the narrowness of credit spreads and the strong upward trend in the stock market are linked, in that they are both symptomatic of a widespread view that a new boom will begin without a preceding severe economic downturn.
The above-mentioned conflict will have to be resolved over the months ahead by credit spreads widening substantially in response to evidence of economic weakness or by the prices of industrial commodities rising substantially in response to evidence that a new boom has been ignited. We think that the former is by far the more likely outcome.