The downward trend continues

May 19, 2025

[This blog post is an excerpt from a commentary published at www.speculative-investor.com last week]

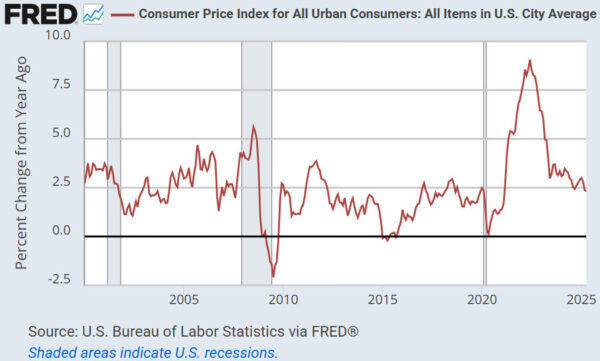
The US CPI numbers reported on Tuesday 13th May extended the downward trend that began in mid-2022. As illustrated by the following chart, the year-over-year growth rate of the US CPI has just made a new cycle low. The Core CPI’s growth rate is significantly higher and was reported to be unchanged at 2.8%, but its annualised growth rate over the past three months is only 2.1%. Therefore, the Core CPI also is moving in the right direction. However, the implications and the outlook are not clear.

The last time the CPI’s growth rate was as low as it was in April of this year was February-2021, at which time the Fed was inflating the money supply aggressively via its QE program and maintaining a target interest rate of around zero. Now, the Fed is still draining money via QT and expects to keep its targeted interest rate at 4.25%-4.50% in the short-term. Why?

The principal problem is that the Fed has no way of knowing what its monetary policy should be, because the correct interest rates and monetary conditions are those that would exist in the absence of the Fed. The Fed is the equivalent of a giant spanner that has been thrown permanently into the monetary works. The best that anyone reasonably can hope for is that the damage it does is counteracted partly by private industry.

A secondary issue is that having exacerbated the inflation problem by being so blatantly late in stopping its monetary easing and starting its monetary tightening during 2020-2022, the Fed is now being overly cautious with regard to any actions that would ease monetary conditions.

A related secondary issue is that the constantly shifting tariff situation is causing uncertainty at the Fed just like it is causing uncertainty everywhere else. The news that the US and China governments have agreed to slash tariffs by 115% — from 145% to 30% in the case of the US and from 125% to 10% in the case of China — is positive, but at this stage the reduced rates are for 90 days only and still leave the average tariff rate for US imports at around 18%, which is the highest since 1934.

The tariffs will be more negative for economic growth than positive for inflation, but they could cause an upward ‘blip’ in the official inflation numbers over the next few months if the economy doesn’t tank in the meantime. The decisionmakers at the Fed are concerned about this possibility and therefore are reticent at the moment to make any moves in the easing direction.

Due to the uncertainty regarding the effects of tariffs, it’s possible that the US economy will have to become very obviously weak before the Fed makes its next decisive move to loosen monetary conditions. If so, this will magnify the severity of the recession that probably has started or will start soon, although the Fed’s slowness to loosen won’t be the primary cause of the recession. The recession will be the result of several years of malinvestment, with a final push coming from the “policy uncertainty” of the past few months.

The coming commodity bull market

May 13, 2025

[This blog post is an excerpt from a recent commentary published at www.speculative-investor.com]

We expect that a 1-2 year or perhaps even longer upward trend in commodity prices will begin this year. Although we will refer to this upward trend as a bull market, strictly speaking it shouldn’t be labelled as such. This is because there actually is no such thing as a commodity bull market, meaning a bull market in a broad index of commodities such as the GSCI Spot Commodity Index (GNX) or the CRB Index. There are only gold bull markets that eventually expand to encompass most commodities. In other words, what we are anticipating is an expansion of the gold bull market to encompass most other commodities.

Gold bull markets begin and are sustained by monetary and governance factors. In short, there is a decline in confidence in the official money and/or the banking system and/or the government that causes an increase in the demand for gold, meaning an increase in the desire to hold gold bullion. These bull markets have nothing to do with gold supply, since for all intents and purposes the supply of gold is constant over a normal investment timeframe*.

Eventually, the issues that have been discounted by the gold market lead to higher prices for many other commodities, but, for all commodities other than gold and to a lesser extent silver, supply can be a major price driver. In fact, the non-monetary commodities that have the most severe supply restrictions tend to be the ones that rise in price the most after monetary/governance factors set in motion a broad upward trend.

Every cycle is different in some way and this time around one of the major differences has been the extent to which price trends have been elongated by the concerted attempts, during 2023-2024, to counteract the Fed’s monetary tightening by pre-emptive recession-like deficit spending on the part of the US government and actions by both the Fed and the Treasury that sustained ‘liquidity’ in the financial markets. These actions postponed the start of a US recession by 1-2 years and also, we think, substantially widened the gap between the start of a gold bull market and the start of a broad upward trend in commodity prices (a gold bull market began in Q4-2022 and a general commodity bull market is yet to begin).

Just as the performance of the gold price telegraphed weakness in the US dollar, it is telegraphing a large, broad upward trend in commodity prices. Furthermore, the upward price trend will be exacerbated by artificial shortages caused by Trump’s trade war. Like the Covid lockdowns, the tariffs and the uncertainty regarding future tariffs have disrupted and will continue to disrupt supply chains.

We expect that a broad upward trend in commodity prices will begin after it becomes sufficiently clear that the US economy is in recession to prompt monetary and fiscal measures designed to stimulate economic activity. This is likely to happen before the end of this year and could happen as soon as the next three months.

*Almost all the gold that has ever been mined remains available to satisfy demand today, with the global mining industry adding only about 1% to this existing stockpile every year.

An equity bear and a commodity boom?

April 30, 2025

[This blog post is an excerpt from a recent commentary posted at www.speculative-investor.com]

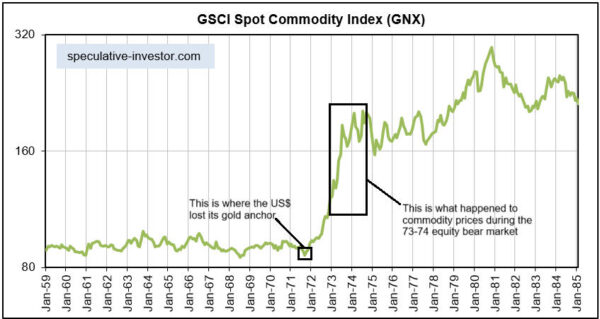
Due to everything we are seeing and expecting, including the performance of the gold price and shortages that potentially will stem from Trump’s trade war, we think there’s a very real possibility that an equity bear market could unfold in parallel with a commodity bull market. If so, it would be very different from anything that happened over the past three decades, a period during which the commodity markets generally weakened when the stock market was very weak, but very similar to what happened during the 1970s. As illustrated by the following monthly chart, a broad basket of commodity prices rose substantially during the equity bear market of 1973-1974.

By the way, the chart also shows the remarkable stability of commodity prices when the US$ was linked officially to gold.

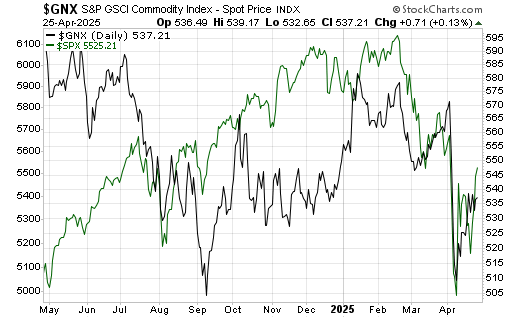
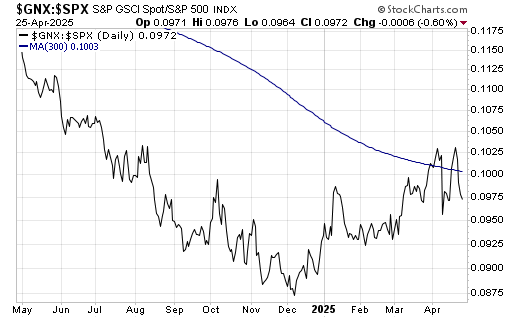
We hasten to point out that right now there is only tentative evidence in the price action to support the above-mentioned scenario. In particular, the first of the following charts shows that equity prices (represented by the SPX and shown in green) and commodity prices (represented by the GNX and shown in black) plunged together in early April and have since rebounded together — price action that does NOT support the idea that commodity prices will be able to trend upward while equity prices trend downward. However, the second chart shows that commodity prices have been strengthening relative to equity prices since early-December of last year.

What we could see over the coming quarters is more of what happened since early-December of last year, with commodity prices generally strengthening relative to equity prices but getting hit during the brief periods when equity prices fall rapidly and there is a rush for liquidity.

The US dollar’s cyclical decline

April 22, 2025

[This blog post is a modified excerpt (for example, it contains updated charts) from a recent commentary published at www.speculative-investor.com]

Think back to how bullish almost everyone was about the US dollar’s prospects at the start of this year. Also recall that our view at the time was that the Dollar Index (DX) was set to make a very important peak in January-2025, after which it would trend downward for at least a year. Actually, our view going into this year was that the DX had commenced a cyclical decline in September-2022 and would resume its cyclical decline in January-2025. The fact that it recently made a new cycle low confirms that the DX has, indeed, been in a cyclical bear market since September of 2022 and that the strong rally from the September-2024 low was nothing more than a countertrend move. So, what now?

Before attempting to answer the above question, we present herewith a daily chart and a weekly chart of the DX. The daily chart shows the virtual crash of the past two weeks, while the weekly chart shows that the DX has broken below its July-2023 low and is at its lowest level since April of 2022. Both charts show that the DX is extremely oversold.

USD_daily_210425

USD_weekly_210425

Due in part to the performance of the US$ gold price, we doubt that the DX’s cyclical decline is complete. This is because on an intermediate-term basis the gold market does not react to trends in the US dollar’s exchange rate, it projects them. For example, gold’s strength last year projected future US$ weakness against other currencies. The fact that the US$ gold price has just made a new all-time high projects future weakness in the DX.

The way that the DX’s true fundamentals are expected to evolve over the months ahead (they are expected to remain bearish) and the paths taken by the DX following comparable highs in September-2022 and January-2017 also point to additional downside.

However, thanks to the recent collapse it’s likely that the bulk of the decline is in the past.

We have had and continue to have the mid-90s in mind as a target for the DX’s ultimate cycle low. This target may have seemed unreasonably bearish a few months ago, but it is only a few points below the current level. At the same time, a countertrend rebound could result in the DX returning to the 104-105 range.

Further to the above, we are now short-term and intermediate-term neutral on the DX. The ultimate cycle low probably won’t be set until the final few months of this year, but the rebound potential is now at least as large as the remaining downside potential.