Gold is probably immersed in a multi-decade bull market containing cyclical bull and bear markets. We can be sure that a cyclical bear market began in 2011, but did this bear market come to an end in December of 2015? In other words, did a new cyclical gold bull get underway in December-2015? I don’t know, but the point I want to make today is that the answer to this question is not as important as most gold-market enthusiasts think.
During the first half of 2016 my view was that although a new cyclical gold bull market had probably begun, it was far from a certainty. The main reason I had some doubt was that gold’s true fundamentals* were not decisively bullish. However, by November of last year I thought it likely that a new gold bull market had NOT begun in December-2015. This was mainly because the true fundamentals had collectively become almost as gold-bearish as they ever get. It was also because it had, by then, become crystal-clear that the US equity bull market did not end in 2015.
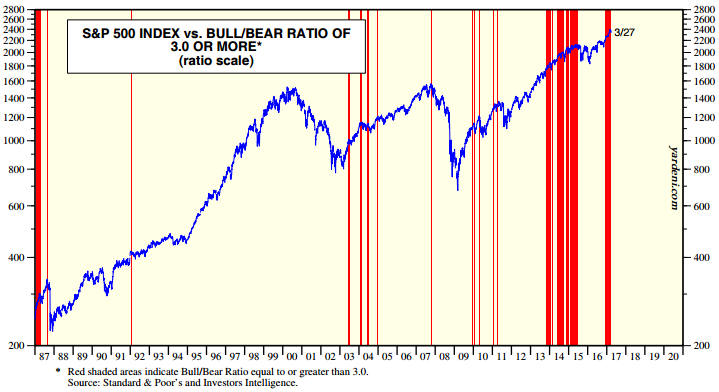
The cyclical trend in the US stock market is important for gold. During any given year the gold price and the US stock market (as represented by the S&P500 Index) are just as likely to move in the same direction as move in opposite directions, but over long periods they are effectively at opposite ends of a seesaw. As far as I can tell, it would be unprecedented for a cyclical gold bull market to begin when a cyclical advance in the US stock market is far from complete.
In any case, for practical speculation purposes there is never a need to answer the question: bull market or bear market? In fact, there is never a need to even ask the question. The question that should always be asked is: based on all the relevant evidence at the current time, should I buy, sell or do nothing?
For example, based on the extreme negativity that prevailed at the time, the length and magnitude of the preceding price decline and a number of other considerations, it could be determined in January-2016 that an excellent opportunity to buy gold-mining stocks had arrived. Coming to this conclusion did not require having an opinion on whether a new gold bull market was getting underway. For another example, during May-August of last year an objective assessment of the price action and the important sentiment indicators revealed numerous excellent opportunities to reduce exposure to the gold-mining sector, regardless of whether or not a new bull market had begun several months earlier. For a third example, the analysis of the salient evidence in real time during December of last year suggested that another sector-wide buying opportunity had arrived in the world of gold mining. Again, taking advantage of this buying opportunity did not require an opinion on whether a cyclical gold bull market had begun back in December-2015.
The upshot is that assertions to the effect that an investment is in a bull market or a bear market can make for colourful commentary, but in the real worlds of trading and investing it’s best not to get hung up on bull and bear labels. As well as being unnecessary, fixating on such labels can be problematic. This is because someone who is convinced that a bull market is in progress will be inclined to ignore good selling opportunities and someone who is convinced that a bear market is underway will be inclined to ignore good buying opportunities.
*In no particular order, the fundamental drivers of the US$ gold price are the real US interest rate (as indicated by the 10-year TIPS yield), US credit spreads, the relative strength of the US banking sector (as indicated by the BKX/SPX ratio), the US yield curve, the general trend in commodity prices and the US dollar’s performance on the FX market (as indicated by the Dollar Index).