A strangely successful gold stock model

March 16, 2020

In TSI commentaries since May-June last year I have been tracking the current performance of the gold mining sector with its performance during the mid-1980s. More specifically, I have been comparing the current HUI with the mid-1980s Barrons Gold Mining Index (BGMI). The chart that illustrates this model is displayed below.

The model predicted the rapid rise in the HUI during June-August of last year, the steep correction from a peak by early-September to an October-November low, the rise to a new multi-year high by January-2020 and the crash to a low in March-2020. The big predictions associated with this model are now in the past, which is why I can take the liberty of including it in a free blog post.

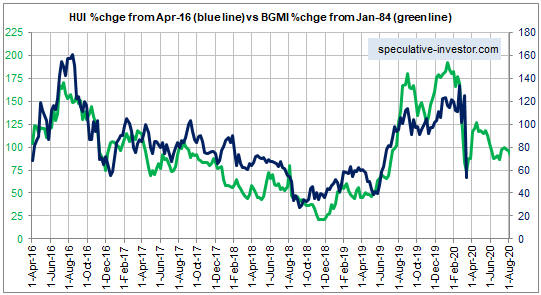
The main point I want to make with this post is that even though the present often looks very different from any previous time, the bulk of what happens in the financial markets has happened before. It’s often just a matter of finding the right historical comparison, which is always easier said than done. Also, valid comparisons with previous times always have limited lifespans. It’s possible, for example, that my comparison with the mid-1980s has almost reached the end of its useful life.

Knowledge of how markets have performed in the past, including the distant past (not just the preceding 10-20 years), is useful even if it doesn’t lead to a specific history-based model. For example, anyone with knowledge of market history knows that when the gold mining sector is stretched to the upside near the start of a general stock market crash, it always crashes with the broad market. As far as I know, there have been no exceptions.

History informs us that after a crash comes a rebound and after a rebound there is usually a test of the crash low.

Gold versus Silver

March 2, 2020

[This blog post is a modified excerpt (with an updated chart) from a TSI commentary published one month ago]

Last July the gold/silver ratio came within 10% of its 50-year high, which was reached in 1991, and within 15% of its multi-century high, which was reached in the early 1940s. The following monthly chart from goldchartsrus.com shows that on a monthly closing basis the ratio has just made a new multi-decade high and is now within 10% of a 300-year high, meaning that silver has almost never been cheaper relative to gold than it is today.

longtermAUAGr1700log

One way to interpret the gold/silver ratio chart is that silver has huge upside potential relative to gold. I think this interpretation is correct, but there is a realistic chance that the ratio will make a new multi-century high (in effect, a new all-time high) before silver embarks on a major upward trend relative to gold.

This is not my preferred scenario, but a new all-time high in the gold/silver ratio could occur within the next 12 months due to a major deflation scare.

My current expectation is that over the bulk of this year there will be US dollar weakness and signs of increasing “inflation”, which is a financial/economic landscape that would favour silver over gold and pave the way for some mean reversion in the gold/silver ratio. However, if the stock market bubble were to burst, economic confidence probably would tank and there would be a panic towards ‘liquidity’. For the general public that would involve building-up cash, but for many large investors it would involve buying Treasury bonds and gold. Silver eventually would benefit from the strength in the gold market, but the silver market is not big enough and liquid enough to accommodate investors who are in a hurry to find a safe home for billions of dollars of wealth. Initially, therefore, the gold/silver ratio could rise sharply under such a scenario.

The scenario described above would lead to panic at the Fed, eventually resulting in the introduction of the most aggressive asset monetisation scheme to date. That’s the point when silver probably would commence a major catch-up move.

The Creeping Nationalisation of Markets

February 24, 2020

23rd February blog post by Sven Henrich hits a couple of nails on the head. Here’s an excerpt:

…the virus…clearly has a short term effect, but rather the broader risk is the excess created by ultra-loose monetary policies that has pushed investors recklessly into asset prices at high valuations while leaving central bankers short of ammunition to deal with a real crisis. There was no real crisis last year, a slowdown yes, but central bankers weren’t even willing to risk that, instead they went all in on the slowdown. It is this lack of backbone and co-dependency on markets that has left the world with less stimulus options for when they may be really needed. Reckless.

Yes, central banks present a vastly greater threat to the economy than the coronavirus. Unfortunately, however, there never will be a vaccine that could immunise the economy from the effects of interest rate manipulation. Also, Sven is wrong when he writes that central bankers are short of ammunition and when he implies that stimulus options of the central planning kind will be needed at some point in the future. These options are always counter-productive and therefore never needed.

Central banks are a long way from being short of ammunition, because there effectively is no limit to the amount of money they can create. They can monetise (purchase with money created out of nothing) pretty much anything. At the moment they generally have restricted themselves to the monetisation of their own government’s debt, but they could expand their bond-buying to encompass investment-grade corporate debt and, if that wasn’t deemed sufficient, high-yield (junk) debt. They also could monetise equities, perhaps beginning with ETFs and working their way down to individual stocks. If they wanted, with a change of some arbitrary rules they could even monetise commercial and residential real estate.

It could be argued that “inflation” (in the popular sense the word: an increase in the so-called general price level) limits the amount of new money that central banks can create, in that after “inflation” starts being perceived as a major threat the central bank will come under irresistible political pressure to tighten the monetary reins. This is one of the tenets of the idiocy known as Modern Monetary Theory, or MMT for short. According to MMT, the government should be able to create out of thin air whatever money it needs, with the “inflation” rate being the only limitation. However, in some developed countries, including the US, many people already are having trouble making ends meet due to the rising cost of living, and yet the central bank claims that the “inflation” rate is too low and senior politicians agree.

As well as distorting price signals and thus getting in the way of economic progress, when the central bank makes long-term additions to its balance sheet it is, in effect, surreptitiously nationalising part of the economy. For example, the Bank of Japan (BOJ) already has nationalised Japan’s government bond market and is well on its way towards nationalising the market for ETFs (the BOJ owns about 80% of all ETF shares listed in Japan).

The creeping nationalisation of markets is something that is rarely, if ever, mentioned during discussions of current and potential monetary stimulus, but it’s a big problem that looks set to get even bigger.

A test for China’s propaganda machine

February 17, 2020

[This blog post is a modified excerpt from a recent TSI commentary]

The main purpose of the GDP growth numbers and most other economic statistics reported by China’s government is to tell the story that the central committee of the Communist Party wants to tell. In other words, the economic numbers form part of the State’s propaganda.

For example, during the first decade of this century the Party’s objective was to show that the economy was performing in spectacular fashion, so the reported GDP growth numbers were almost never below 8% and regularly above 10%. In more recent years the overriding concern has been to paint a picture of stability and sustainable progress, which has involved reporting consistent GDP growth in the 6%-7% range. Refer to the following chart for more detail. Amazingly, most Western analysts accept these figures as if they were accurate reflections of reality, partly, we suspect, because there is no way to prove that what’s being reported is bogus.

Once in a while, however, something happens that shines a light on the meaninglessness of the official numbers. An example was the claim by China’s government that its economy was still growing at an annualised pace of more than 6% during the worst point of the 2007-2009 global recession. Another example very likely will be the quarterly GDP growth that China’s government reports for the first quarter of this year.

The consensus view in the financial news media appears to be that due to the SARS-CoV-2 virus, China’s GDP growth rate in Q1-2020 will slide from 6%+ to ‘only’ 4%-5%. The reality, however, is that China’s economy could not be growing at the moment. Large sections of the country have been essentially put in lock-down mode, and many factories, restaurants, shops and other businesses have been temporarily closed. Tourism has ground to a halt, home sales have collapsed by 90% and vehicle sales are expected to fall by 50%-80% from the same period last year. In some large Chinese cities, including Shanghai, the government has directed state property owners not to collect rent from small- and medium-sized businesses during February and March.

Other examples of the virus’s dampening effect on economic activity are included in articles published on 13th February at the South China Morning (SCMP) and Caixin. According to the SCMP article:

Recruitment site Zhaopin said this week that around 10 per cent of firms they surveyed were “on the verge of death”, with around 30 per cent planning job cuts and another 30 per cent saying they could not pay their employees on time.

Along similar lines, the Caixin article notes:

Even before the outbreak, many small businesses were already grappling with shrinking sales as China’s economy logged some of its slowest growth in decades. With business now at a standstill during the outbreak, many are facing existential liquidity crises. Large numbers say they are having difficulties just paying salaries, adding they can only survive for a matter of months using their current resources, even if Beijing provides support.

It should be obvious to anyone with at least rudimentary knowledge of the world that China’s economy is contracting right now. Therefore, if the government reports GDP growth of 4%+ for the first quarter of this year it will be a tacit admission that the official numbers are totally fictitious. By the same token, to retain any semblance of credibility China’s government will have to admit that its economy shrank during the first quarter of this year.

That’s why China’s next quarterly GDP number will be a test.