[This blog post is an excerpt from a recent commentary at https://speculative-investor.com/]
In January of last year, we presented a list of items that would support the coming bull market in commodities. We subsequently reiterated and added to this list. Due to the events of the past two months another addition is appropriate, but to refresh memories here are the points mentioned previously:
1) Investments in AI-related datacentres and the associated infrastructure (power plants, pipelines, transmission lines, transportation services) will add significantly to commodity demand for years to come, even if the stock prices of the biggest spenders (the so-called “hyperscalers”) have reached their peaks. This is based on the datacentres already under construction and planned to commence construction.
This AI-related investment continues to have a very significant effect on the US economy. It is, in fact, the main reason that the US economy continues to grow.
2) The commercial demand for commodities will be boosted by the rebuilding of Ukraine, the rebuilding of Gaza and the construction of the massive Yarlung Tsangpo Hydroelectric Project in China.
3) Government trade policy is likely to put upward pressure on commodity prices in some parts of the world, most notably in the US, by making the trading of commodities less efficient. For example, whereas previously it would have made sense to import a commodity rather than produce it locally, due to tariffs it could make more sense to produce locally. However, it generally takes several years to build a new mine and the mine-building process itself consumes large quantities of commodities.
4) The combination of a weaker US$ and increased government spending around the world will both support the commercial demand for commodities and boost the speculative demand for commodities as an inflation hedge. The buying of commodity futures and physical commodities to hedge against currency depreciation contributed to the commodity bull market of the 1970s.
5) Even though investment in ‘renewable’ energy such as solar and wind is now being de-emphasised or actively discouraged by the US government, there continues to be massive investment in these forms of energy around the world and especially in China. This will boost the commercial demand for industrial metals.
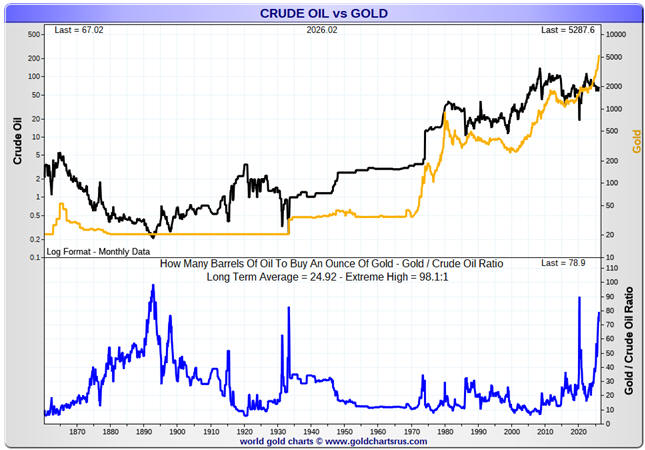
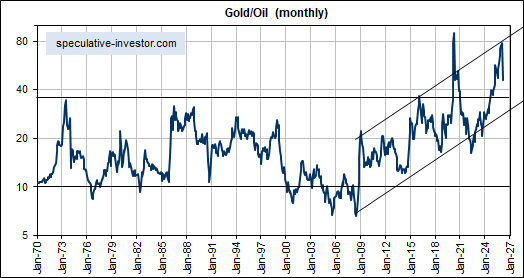
6) The gold bull market that began in late-2022 projected a subsequent commodity bull market (commodity bull markets are just gold bull markets that have broadened). We have conclusive evidence in the price action that a commodity bull market began last year, and cyclical bull markets in commodities usually last at least two years.
The above points remain valid, and we can add the US-Israel-Iran war to the List. This war will fuel the commodity bull market in these ways:
a) Due to the damage it has caused to oil and LNG production facilities, the prices of oil and LNG will be higher than otherwise would have been the case over the next 1-2 years.
b) There will be increased commodity demand associated with massive rebuilding works in Iran and the rectification of the energy infrastructure that has been damaged throughout the Gulf region.
c) By creating a temporary shortage of fertiliser and raising the price of fertiliser, it will result in less fertiliser being used this year, leading to lower crop yields and higher agricultural commodity prices next year.
d) By reducing the supply of sulphur and thus boosting its price, the costs of fertiliser production, mining and petroleum refining have increased. This will lead to higher prices for grains, industrial metals and petroleum products.
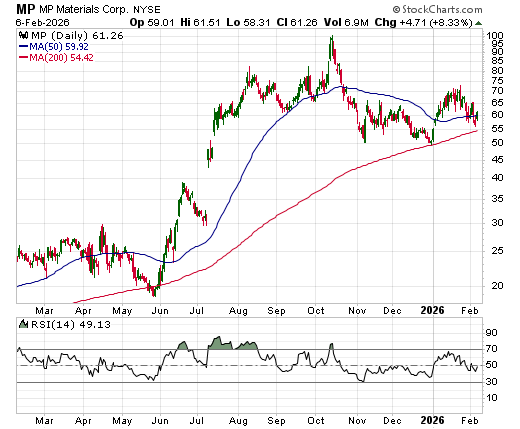
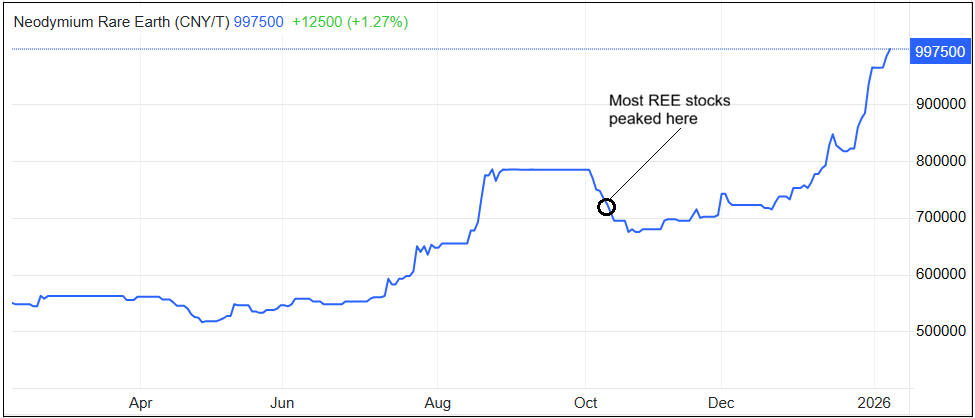
e) The need to replenish the missiles, bombs and other weapons/equipment used by the armed forces will significantly add to demand for some commodities, chief among them being Rare Earth Elements (REEs).
f) US government spending will be hundreds of billions of dollars more than otherwise would have been the case. In essence, the US government has broken a lot of windows and over the coming year will spend a lot of money to get back to where it was prior to the war. This non-productive public-sector spending will elevate prices and increase the private sector’s desire to own commodities or the stocks of commodity producers as a hedge.
Further to the above, the commodity bull market is very much intact and looks set to extend into 2027-2028. Consequently, significant corrections in the stocks of commodity-related equities should be viewed as buying opportunities.