The yield curve is a remarkably useful leading indicator of major economic and financial-market events. For example, its long-term trend can be relied on to shift from flattening to steepening ahead of economic recessions and equity bear markets. Also, usually it will remain in a flattening trend while a monetary-inflation-fueled boom is in progress. That’s why I consider the yield curve’s trend to be one of the true fundamental drivers of both the stock market and the gold market. Not surprisingly, when the yield curve’s trend is bullish for the stock market it is bearish for the gold market, and vice versa.
A major steepening of the yield curve will have one of two causes. If the steepening is primarily the result of rising long-term interest rates then the root cause will be rising inflation expectations, whereas if the steepening is primarily the result of falling short-term interest rates then the root cause will be increasing risk aversion linked to declining confidence in the economy and/or financial system. The latter invariably begins to occur during the transition from boom to bust.
A major flattening of the yield curve will have the opposite causes, meaning that it could be the result of either falling inflation expectations or a general increase in economic confidence and the willingness to take risk.
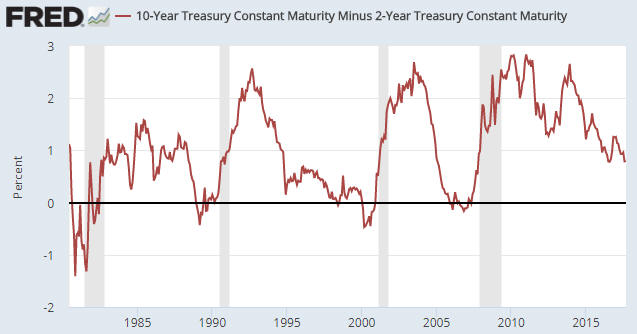
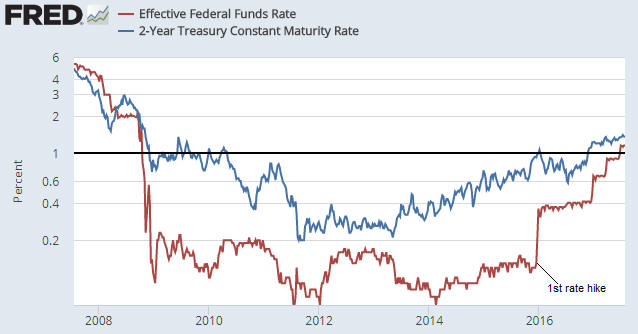
On a related matter, the conventional wisdom is that a steepening yield curve is bullish for the banking system because it results in the expansion of banks’ profit margins. While superficially correct, this ‘wisdom’ ignores the reality that one of the two main reasons for a major steepening of the yield curve is widespread, life-threatening problems within the banking system. For example, the following chart shows that over the past three decades the US yield curve experienced three major steepening trends: the late-1980s to early-1990s, the early-2000s and 2007-2011. All three of these trends were associated with economic recessions, while the first and third got underway when balance-sheet problems started to appear within the banking system and accelerated when it became apparent that most of the large banks were effectively bankrupt.
Here’s an analogy that hopefully helps explain the relationship (under the current monetary system) between major yield-curve trends and the economic/financial backdrop: Saying that a steepening of the yield curve is bullish because it eventually leads to a stronger economy and generally-higher bank profitability is like saying that bear markets are bullish because they eventually lead to bull markets; and saying that a flattening of the yield curve is bearish because it eventually — after many years — is followed by a period of severe economic weakness is like saying that bull markets are bearish because they always precede bear markets.
Both rising inflation expectations and increasing risk aversion tend to boost the general desire to own gold, whereas gold ownership becomes less desirable when inflation expectations are falling or economic/financial-system confidence is on the rise. Consequently, a steepening yield curve is bullish for gold and a flattening yield curve is bearish for gold.
The US yield curve’s trend has not yet reversed from flattening to steepening, meaning that its present situation is bullish for the stock market and bearish for the gold market. However, the yield curve is just one of seven fundamentals that factor into my gold model and one of five fundamentals that factor into my stock market model.