[This blog post is an excerpt from a TSI commentary published last week]
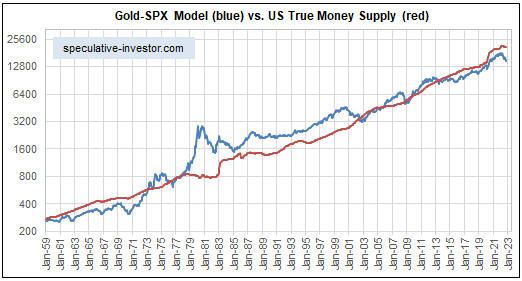
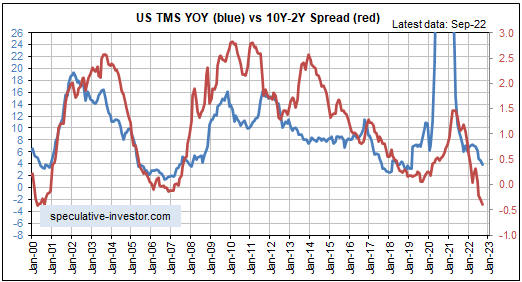
Monetary inflation is the driver of the economic boom-bust cycle, with booms being set in motion by rapid monetary inflation and busts getting underway after the rate of new money creation drops below a critical level and/or it becomes impossible to complete projects due to resource shortages. The following chart shows that the US monetary inflation rate (the year-over-year growth rate of US True Money Supply) extended its decline in October-2022 and is now only 2.6%, down from a peak of almost 40% early last year.
In previous TSI commentaries we wrote that if the Fed were to stick with its balance-sheet reduction plan then by next February the year-over-year rate of US money supply growth probably would be negative, that is, the US would be experiencing monetary deflation. Because nothing disastrous has happened to the overall US economy and the broad stock market YET (at this stage, the disasters have been confined to the economic/market sectors where speculation was the most manic), the Fed almost certainly will stick with its balance-sheet reduction plan for at least a few more months. This means there is a high probability of the US experiencing monetary deflation during the first half of 2023. What would be the likely ramifications?
In a healthy economy a year-over-year decline in the money supply of a few percent would not be a big problem, whereas an economy rife with bubble activities stemming from a massive prior increase in the money supply is not healthy and would be expected to experience a severe downturn in response to monetary deflation or even a period of relative money-supply stability. The current US economy is an example of the latter, making it acutely vulnerable to monetary deflation.
Declining money-supply growth hits the most egregious bubble activities first. For example, many of the most popular stock market speculations of the 2020-2021 bubble period already have lost more than 90% of their market values and the ‘crypto world’ is immersed in a collapse that probably isn’t close to complete. Unfortunately, though, when price signals become distorted by monetary inflation to the point where mal-investment has occurred on a grand scale, it isn’t just the businesses directly involved in the bubble activities that suffer life-threatening contractions after the bubbles burst. Almost everyone gets hurt.
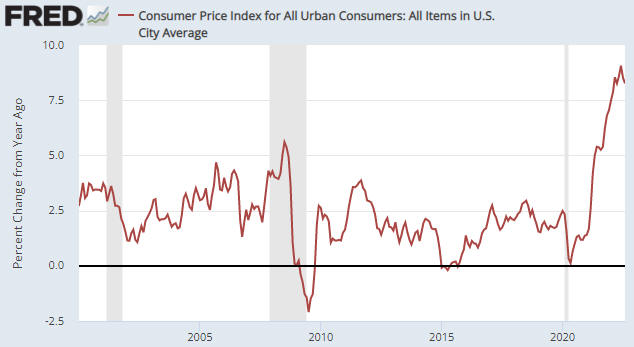
A severe economic downturn during 2023 that possibly extends into 2024 is one ramification of the on-going slide in the monetary inflation rate. Another is that the US economy could experience price deflation, as indicated by the year-over-year rate of CPI growth dropping below zero, during the final quarter of 2023. This combination will, we suspect, lead to a substantial rebound in the Treasury market and a rise in the US$ gold price to new all-time highs within the coming 12 months.
It almost goes without saying that a severe recession and a collapse in the CPI during 2023 will prompt the Fed to initiate another round of money pumping with all of the usual knock-on effects, including new waves of mal-investment and price inflation.
 Print This Post