“Nobody Knows Anything” is a new book written by Bob Moriarty, the proprietor of the 321gold.com web site. It’s close to the book that I would write about investing, but Bob is a better writer than I so it is just as well that he wrote the book before I got around to it.
Achieving good returns by trading/investing in the stock market and other financial markets isn’t complicated. While a certain amount of information gathering and historical knowledge is required, achieving good returns has a lot to do with common sense. However, this doesn’t mean that it is easy. The problem is that we are most comfortable when running with the herd, but herds never have common sense and the investing herd always ends up losing money.
In the chapter on contrarian investing, Bob rightly points out that one of the keys to long-term investing success is not following the herd as it careens from one wealth-destroying blunder to the next.
Many people want to be told what the markets are going to do in the future and especially want to be given specific information about future crashes and spectacular price rises. This creates money-making opportunities for self-styled gurus.
As Bob explains in his book, there are no gurus. Nobody knows exactly when prices will rise, fall, peak and trough, but there is no shortage of people who will happily take your money in exchange for pretending to give you this extremely useful information. What these people are actually giving you are guesses dressed up to look like scientific analyses.
The fact is that in order to consistently buy low and sell high you don’t need to know, or even have an opinion about, when and at what level a market will peak or trough, but advice that helps you manage money prudently will not attract new readers/followers anywhere near as quickly as a big forecast such as “the market will peak on Date X and then plummet by 50%”. As I’ve noted in the past, there is an asymmetric risk/reward to making the big, bold forecast, because failed forecasts are soon forgotten whereas a single correct forecast (guess) about a dramatic market move can be used for promotional purposes forever.
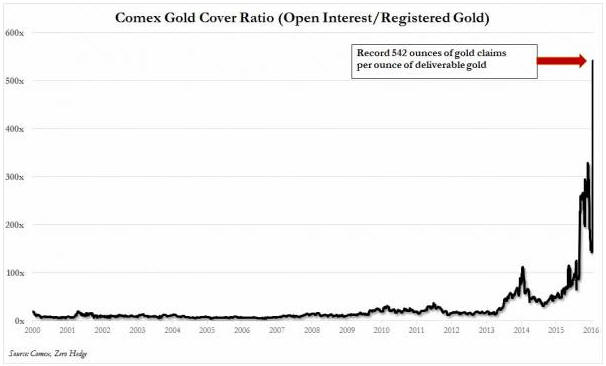
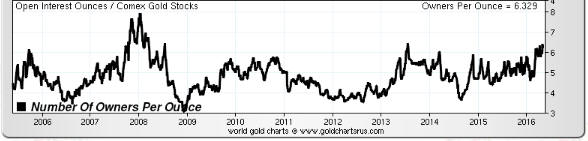
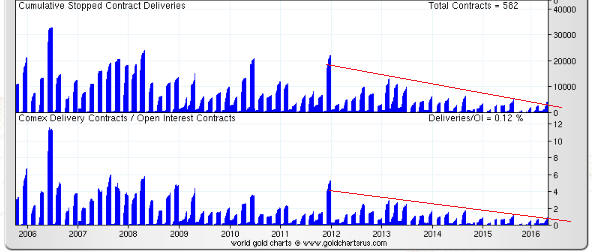
There are many real-life examples in Bob’s book that are directly or indirectly related to the veritable industry that has grown up over the past 18 years around gold and silver manipulation. After explaining that all markets have always been manipulated, Bob delves into some of the silly stories that have been concocted and the terms that have been invented to promote the idea that the gold and silver markets have been subject to a successful multi-decade price-suppression scheme. Because it’s a fact that all financial markets are always manipulated to some extent, it is not difficult to find information that can add a ring of plausibility to a manipulation story that is not only wrong, but would be irrelevant to an investor or trader even if it were right.
Read the book to find out what Bob thinks about the “gold derivatives time bomb”, the possibility of a “commercial signal failure” in the gold market, the risk of a COMEX default, the notion that the “commercials” in the gold futures market are constantly trying to limit up-moves in the price, “naked shorts”, gold-plated tungsten bars, and the story that the 1998 Fed bailout of Long Term Capital Management (LTCM) was at least partly due to LTCM’s short position in gold.
The most important chapter in the book is probably the one titled “When to Sell”, because failing to take money off the table at an appropriate time gets many investors into trouble. Even in cases where an investor does a good job with the buy side of the equation and gets into a position where he has a large profit, dreams of the even greater profits to come will often prompt him not to sell. Instead, he hangs on…and hangs on…until eventually the large profit turns into a loss.
Bob draws on his experiences in the military (he was a fighter pilot during the Vietnam War) and in casinos to illustrate some of the points he wants to make about investing. These personal reminiscences from outside the world of investing are colourful and relevant.
At around 120 pages the book is short, but at the same time it is long on practical information. It is a stream of investing common-sense interspersed with historical examples and personal experiences. I think it would be an enjoyable read even if you aren’t involved in the financial markets, but it should be an especially enjoyable and useful read for anyone who speculates in the shares of junior gold, silver and other natural-resource companies.