I was blown away by the following two charts from Jeffrey Snider’s article titled “The European Basis For New Monetary Science“.
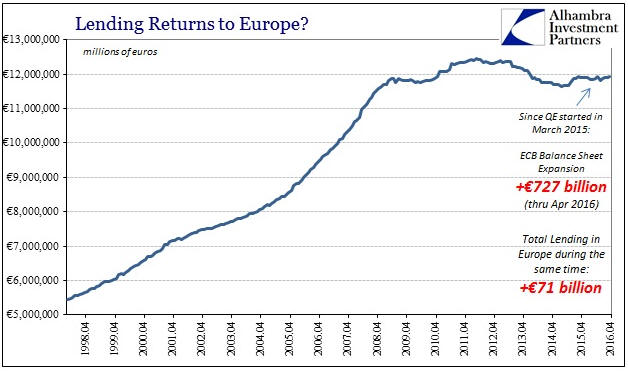
As most of you probably know, the Mario Draghi-led ECB embarked on a ‘suped-up’ QE program in March of 2015. The idea behind this program was that by monetising 60B euros of bonds per month the ECB would promote faster credit expansion throughout Europe. The two charts from the aforelinked Snider article show the results to April-2016.
The first chart shows that as at April-2016, 727 billion euros of ECB asset monetisation had been accompanied by an increase in total lending of only 71 billion euros. As neatly summarised by Snider, this means that there was less than one euro in additional lending for every ten in ECB foolishness.
The second chart shows loans to European non-financial corporations, which actually contracted slightly during the first 13 months of the ECB’s suped-up credit-expansion program.
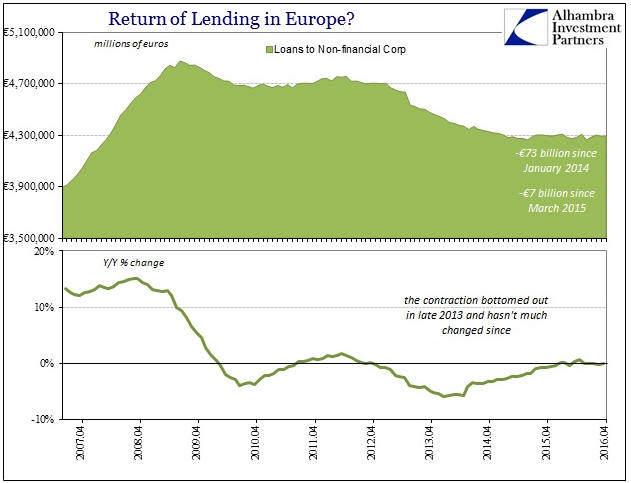
The QE program was therefore a total failure even by the jaundiced standards of the central-banking world, that is, it failed even ignoring the reality that faster credit expansion cannot possibly be good for an economy labouring under the weight of excessive debt. The weirdest thing is, the obvious failure is not viewed by Draghi as evidence that QE doesn’t do what it is supposed to do. Instead, it is viewed as evidence that more of the same is needed. Hence the increase in the pace of asset monetisation from 60B to 80B euros per month announced in March-2016 and implemented this month.
I shudder to think how Draghi’s monetary experiment will end.