Gold and Confidence

March 1, 2016

This post is a modified excerpt from a recent TSI report.

A point I’ve made many times in TSI commentaries over the years is that the major trends in gold’s relative value have nothing to do with what most people think of as “inflation” (a rising CPI). They are, instead, driven by shifts in how the financial establishment (the central bank plus the commercial banks) is perceived and by shifts in the perception of economic growth prospects. In more general terms, they are driven by shifts in confidence. There are times when a substantial decline in confidence is related to rising inflation expectations, but in developed economies there are more times when it isn’t. And even when it is, it’s not really the decline or the expected decline in the purchasing power of money that results in a greater desire to own gold; it’s the belief* that the stewards of the monetary system are losing control.

The happenings of the past three months constitute an excellent example. Inflation expectations were low when gold began to turn upward in December and if anything are even lower now, but over the past several weeks we had a very fast rally in the real gold price. It should be clear to any knowledgeable observer that the rally had absolutely nothing to do with fear of “CPI inflation”. Rather, it was driven by the combination of fear that the economically-destructive insanity known as Negative Interest-Rate Policy (NIRP) will spread to the US and fear of banking collapse in Europe.

Everything that the world’s most important central banks are doing is based on logical conclusions drawn from false premises. The false premise upon which interest-rate suppression is based is that economic growth is caused by borrowing and consumption. The reality is that saving is the foundation of sustainable economic growth. By pursuing policies that punish saving and reward borrowing, central banks set the scene for slower economic progress.

Now, progress-hindering monetary policy is not something new. It has been the order of the day for a very long time, but it has never before been taken to such extremes. Moreover, senior central bankers are making it crystal clear that they are not close to being done — that they are ready and willing to continue along the current path if the relentless beatings fail to lift morale — even though it is becoming more obvious by the day that the unconventional monetary policies have hurt far more than helped.

The upshot is that today’s central bankers are completely stupid, where stupid is defined as having an unwitting tendency towards self destruction**. Unfortunately, due to their immense power these men and women are taking entire economies along for the ride. The gradual dawning that this is happening is why gold is getting more popular.

*Central banks and governments never had genuine control, but there has been widespread BELIEF over the past several years in the abilities of central banks to create stronger economies.

**The Doug Casey definition.

Print This Post Print This Post

An oil glut doesn’t preclude an oil price bottom

February 23, 2016

This blog post is a modified excerpt from a 17th February TSI commentary.

I don’t need to read/watch the news to know that the supply-demand backdrop remains unsupportive for the oil price. All I have to do is look at the spread between spot prices and futures prices in the oil market. The larger the contango, that is, the higher the futures price relative to the spot price, the more abundant the current supply and the less price-supportive the so-called ‘fundamentals’.

As recently as a few days ago, oil for delivery in July-2016 was $6.40/barrel, or about 20%, more expensive than oil for immediate delivery onto the cash market. This was very unusual. It meant that if someone could buy physical oil and store it cheaply they could make a risk-free annualised return of almost 40% by simultaneously selling July futures contracts. The reason that every man and his dog was not eager to do this trade is that the cost of storing oil is now so high that even a contango that represents a potential 40% annualised return on a physical-futures arbitrage is not very profitable. And the reason that the cost of storing oil is now so high is that there is a much-greater-than-normal amount of oil already in storage.

Unfortunately, knowing that there is an oil glut and, therefore, that the ‘fundamentals’ remain bearish doesn’t tell us what will happen to the oil price in the future. This is because the bearish fundamentals are very well known and are factored into the current price. It is also because the fundamentals are always bearish at major price bottoms in commodities markets.

I suspect that the oil price is now close to a major bottom. This is because at its recent low the “inflation”-adjusted oil price was below its 1986 bottom and almost as low as its 1998 bottom (the two lowest points of the past 40 years). It is also because if stock markets have made long-term peaks then the commodities markets are likely to be among the main beneficiaries of future monetary inflation.

However, it’s very unlikely that there will be a ‘V’ bottom in the oil market. Considering the short-term positive correlation between the oil price and the S&P500 Index (see chart below) and the well-known bearish fundamentals, it’s more likely that the oil market will build a base this year involving a Q1 bottom and one or two successful tests of the bottom.

oil_SPX_220216

Print This Post Print This Post

The “Streetlight Effect” in the gold market

February 22, 2016

In an old joke, a policeman sees a drunk searching for something under a streetlight and asks what he has lost. The drunk says that he lost his keys, and they both start looking under the streetlight together. After a few minutes the policeman asks the drunk if he is sure he lost them here, and the drunk replies, “no, I lost them in the alley”. The policeman then says “so why are you looking here?”, and the drunk replies, “because this is where the light is”. This joke led to the name “Streetlight Effect” being given to a psychological tendency for people to look for clues where it is easiest. Many gold-market analysts have obviously succumbed to this psychological tendency.

It is obvious that many gold-market analysts have succumbed to the “Streetlight Effect” because they fixate on a tiny fraction of the overall gold supply and they do so because this tiny fraction of the overall supply is where the well-defined numbers are. The rest of the supply, which probably accounts for at least 90% of the total, is ignored because its location can’t be pinpointed and its size can’t be accurately measured. In effect, due to a lack of definitive data they make the assumption that the bulk of the world’s gold supply doesn’t exist. No wonder their supply-demand analyses don’t make sense.

To be more specific, there are many gold-market analysts who focus on the amount of gold produced by the mining industry, the amount of gold in COMEX warehouses, the publicly-reported warehouse stocks in London and the bullion inventories of gold ETFs, as if the sum of these quantities was a reasonable estimate of the world’s total amount of gold in saleable form. This is a huge mistake. Furthermore, they assume that once gold leaves a warehouse for which there are publicly-reported numbers the gold effectively ceases to exist, as if it has evaporated into the air. However, it is far more reasonable to assume that almost every ounce of gold that leaves a publicly-reported inventory remains part of the total supply.

In any case and as I explained last week, even if the “Streetlight Effect” didn’t apply and the location of every ounce of aboveground gold was known, the information wouldn’t tell us anything about the price and therefore wouldn’t be useful from an investing/speculating perspective.

Print This Post Print This Post

Can a US recession occur without an inverted yield curve?

February 19, 2016

This blog post is a modified excerpt from a recent TSI newsletter.

One of the bullish arguments on the US economy and stock market involves pointing out that a) the yield curve hasn’t yet signaled a recession, and b) the historical record indicates that recessions don’t happen until after the yield curve gives a warning signal. This line of argument arrives at the right conclusion for the wrong reasons.

The bullish argument being made is that every recession of the past umpteen decades has been preceded by an inverted yield curve (indicated by the 10-year T-Note yield dropping below the 2-year T-Note yield). The following chart shows that while the yield curve has ‘flattened’ (the 10yr-2yr spread has decreased) to a significant degree it is still a long way from becoming inverted (the yield spread is still well above zero), which supposedly implies that the US economy is not yet close to entering a recession.

The problem with the argument outlined above is that it doesn’t take into account the unprecedented monetary backdrop. In particular, it doesn’t take into account that as long as the Fed keeps a giant foot on short-term interest rates it will be virtually impossible for the yield curve to invert. It should be obvious — although to many pundits it apparently isn’t — that the Fed can’t hold off a recession indefinitely by distorting the economy’s most important price signal (the price of credit), that is, by taking actions that undermine the economy.

The logic underpinning the bullish argument is therefore wrong, but it’s still correct to say that the yield curve hasn’t yet signaled a recession. The reason is that an inversion of the yield curve has NEVER been a recession signal; the genuine recession signal has always been the reversal in the curve from ‘flattening’ (long-term interest rates falling relative to short-term interest rates) to ‘steepening’ (long-term interest rates rising relative to short-term interest rates) after an extreme is reached. It just so happens that under more normal monetary conditions, an extreme isn’t reached and the reversal therefore doesn’t occur until after the yield curve becomes inverted.

This time around the reversal will almost certainly happen well before the yield curve becomes inverted, but it hasn’t happened yet.

Print This Post Print This Post

Changes in gold location say nothing about the gold price

February 16, 2016

It’s amazing how much time and effort is spent by some analysts in attempting to track the movements of gold between locations. It’s amazing because such analysis provides no useful information about price, that is, such analysis has no practical value for speculators and investors.

Regardless of whether the gold price is in a rising trend or a falling trend, some parts of the world will be net buyers and other parts of the world will be net sellers. Furthermore, the amount of gold being shifted between sellers and buyers could rise or fall during a rising price trend or a falling price trend. To put it more succinctly: transaction volume does not indicate price direction.

Consequently, even if it were possible to track all of the movements in gold that were happening throughout the world every day, the resulting data would not provide reliable clues about the future change in the gold price. In fact, the data wouldn’t even do a good job of explaining past changes in the gold price. And in any case, accurately tracking the movements of gold is not remotely close to being possible.

A common mistake is to fixate on the gold being stored in LBMA and COMEX inventories, as if these publicly-reported warehouse stocks represented the total amount of privately-held gold in saleable form. A related mistake is to assume that when gold is shifted out of a publicly-reported inventory it has effectively been taken off the market and is no longer part of the available supply.

In reality, the bulk of the world’s privately-held gold in readily-saleable form will NEVER be part of a publicly-reported inventory. That’s due to the perceived nature of gold. Many people own gold for store-of-value or financial-safety purposes and do not want to report their ownership, especially to governments. On a related point, just because gold has been removed from an LBMA or a COMEX warehouse and can no longer be tracked by the likes of Gold Fields Mineral Services (GFMS) does not mean that the gold is no longer part of the supply-demand equation. It is still available; it’s just that you, the analyst, have no way of knowing where it is.

Gold-market analysts should accept reality and stop pretending that the supply of gold is limited to the amount that they can pinpoint.

Print This Post Print This Post

There is nothing inherently wrong with market manipulation

February 15, 2016

The financial markets have always been manipulated and always will be manipulated. They are manipulated when they are free and they are manipulated when they are heavily regulated by government. If you choose to be involved in the markets, you should accept this reality. If you cannot accept this reality then you should get out of the markets and never return. If you try to change this reality by advocating greater government regulation of the markets then you are part of the problem.

Manipulating a market involves attempting to give yourself an advantage by encouraging the price to move higher or lower. For example, if you wanted to buy you would possibly try to create the impression that there is greater supply than is actually the case, prompting other traders to sell and causing the price to decline. If you wanted to sell you would possibly try to create the impression that there is greater demand than is actually the case, prompting other traders to bid-up the price. Whether currently legal or not, there is nothing ethically wrong with private entities using such tactics*.

A hundred years ago the manipulation of market prices was generally not considered to be unfair. In fact, highly-respected traders such as Jesse Livermore would sometimes be hired for the purpose of manipulating a market in such a way as to allow a large position to be either bought or sold at a better price than could otherwise be achieved. The best traders could do this by selling and buying in such a way as to create a false impression of the underlying market strength in the minds of other traders.

These days, governments are heavily involved in the financial markets in an effort to create a “level playing field”. As a result, the average investor has never before been at such a disadvantage. Rather than the likes of Jesse Livermore manipulating prices of individual securities from time to time, we now have central bankers treating the major financial markets as if they were puppets that could be moved in any desired way by pulling the right strings.

Never before have prices in the financial markets been so distorted and deceptive, but people now feel more secure because it is clear that the government and its agents are hard at work ensuring that nobody can take advantage of anbody else. Moreover, whenever anything goes wrong in the markets the popular outcry is: “The government oughta do something!” So, everytime something goes wrong and a lot of people lose money it creates the justification for even greater regulation with the stated goal of making the markets safer.

A lot of people are horrendously misguided. They believe that the right government regulations are needed to create a free market, but this only demonstrates that they have absolutely no idea what a free market is. A genuinely-free market is one that is devoid of government intervention. As soon as the government starts regulating a market, the market is no longer free. The greater the regulation, the less free the market.

Is there a reason to be optimistic that a shift towards freer markets lies in the not-too-distant future?

Unfortunately, no, because very few people are prepared to give up even an ounce of perceived security to gain a pound of additional freedom.

*Note: Not all actions that fall under the “manipulation” umbrella are ethical. For example, whether legal or not, it would generally not be ethical for a bank or broker to front-run the orders of its customers if doing so resulted in the customers getting a worse price. Such actions are a breach of trust and/or fiduciary duty. Also, regardless of whether or not its purpose is price manipulation, government involvement in the financial markets is generally unethical because governments operate with stolen money.

Print This Post Print This Post

Gold versus silver during bull markets

February 10, 2016

This post is a modified excerpt from a recent TSI report.

A popular view is that silver outperforms gold during bull markets for these metals, but that’s only true if the entire bull market is considered. That is, it’s true that silver has in the past achieved a greater percentage gain than gold from bull-market start to bull-market end. However, since the birth of the current monetary system the early stages of gold-silver bull markets have always been characterised by relative WEAKNESS in silver.

To check that this is, indeed, the case, refer to the following long-term chart of the silver/gold ratio. The boxes labeled A, B and C on this chart indicate the first two years of the cyclical precious-metals bull markets of 1971-1974, 1976-1980 and 2001-2011, respectively. Clearly, silver underperformed gold during the first two years of each of the last three cyclical precious-metals bull markets that occurred within secular bull markets. Therefore, assuming that a gold bull market has either just begun or will soon begin, on what basis should we expect to see persistent and substantial strength in silver relative to gold over the coming 1-2 years?

The one plausible answer to the above question is that the scope for additional weakness in silver relative to gold has been greatly diminished by the extent to which silver has already fallen relative to gold. In particular, in gold terms silver is now almost as cheap as it was in early-2003 (2 years into the most recent previous bull market), which means that it is close to its lowest price of the past 20 years. Silver is also now vastly cheaper relative to gold than it was when cyclical bull markets were getting underway in 1971 and 1976.

In summary, history tells us to expect continuing weakness in silver relative to gold during the first two years of the next precious-metals bull market (which has possibly just begun), whereas the unusually-depressed current level of the silver/gold ratio suggests that the historical precedents might not apply this time around.

I don’t have a strong preference either way.

Print This Post Print This Post

The US government debt held by the Fed is interest free

February 8, 2016

There are things that monetary enthusiasts* such as me take for granted that are not widely understood. In an email discussion with a friend and fellow monetary enthusiast it occurred to me that the treatment of interest paid on the debt held by the Fed might be one of those things. That’s the reason for this short post.

The Fed currently has about 4.2 trillion dollars of debt securities on its balance sheet, about 2.5 trillion dollars of which are US Treasury securities. The interest that the Fed earns on all of its debt securities — less a relatively small amount to cover the Fed’s own operating expenses — gets paid into the General Account of the US Treasury. In other words, the interest that the US government pays on the Treasury bonds, notes and bills held by the Fed gets returned to the government. This effectively means that any US government debt held by the Fed is interest free.

An implication is that if government debt is held by the Fed, the interest rate on the debt is irrelevant. An interest rate of 20% is essentially no different to an interest rate of 1%, since whatever is paid by the government returns to the government.

Another implication is that when considering what-if interest-rate scenarios and the ability of the US government to meet its financial obligations under the different scenarios, the assumption should be made that the portion of the debt held by the Fed has an effective interest rate of zero. For example, let’s say that at some point in the distant future the average interest rate on the US government’s debt has risen to 10% and the Fed owns 80% of the debt. In this hypothetical — but not completely farfetched — situation, the effective average interest rate on the US government’s debt would only be 2%.

The bottom line is that it’s not so much the Fed’s interest-rate suppression that benefits the US government, it’s the fact that the interest-rate suppression is conducted via the large-scale accumulation of the government’s debt.

* People who spend significant time every week tabulating/charting monetary statistics and poring over reports published by the US Federal Reserve and other central banks.

Print This Post Print This Post

Explaining gold’s relative expensiveness

February 5, 2016

In the blog post “Some gold bulls need a dose of realism“, I noted that relative to the Goldman Sachs Spot Commodity Index (GNX) the gold price was at an all-time high and about 30% above its 2011 peak. I then wrote: “Rather than imagining a grand price suppression scheme involving unlimited quantities of “paper gold” to explain why gold isn’t more expensive, how about trying to explain why gold is now more expensive relative to other commodities than it has ever been.

A rational explanation of gold’s relative expensiveness begins with the premise that major trends in the gold/commodity ratio are invariably associated — in an inverse manner — with major trends in economic confidence. Since credit spreads are one of the best indicators of economic confidence, with generally-widening credit spreads signifying declining confidence and generally-narrowing credit spreads signifying rising confidence, it would be logical if there were a positive correlation between the gold/commodity ratio and credit spreads. As evidenced by the following chart, that’s exactly what there is.

goldGNX_IEFHYG_030216

The current widening trend for credit spreads dates back to mid-2014, which is when the oil price began to trend downward and obvious cracks began to appear in the global growth theme. More recently, cracks began to appear in the US growth theme and the pace of credit-spread widening accelerated, leading to an accelerated rise in the gold/commodity ratio.

Could gold become even more expensive relative to commodities in general? The answer is yes, but only if economic confidence continues to decline.

I doubt that the decline in economic confidence has run its course, so I expect the gold/commodity ratio to move further into new-high territory before something more important than a short-term top is put in place. However, there’s a good chance that the gold/commodity ratio will make a multi-year peak this year, due mainly to increasing strength (catch-up moves) in other commodities.

Print This Post Print This Post
A chart that refutes the gold price suppression story

February 2, 2016

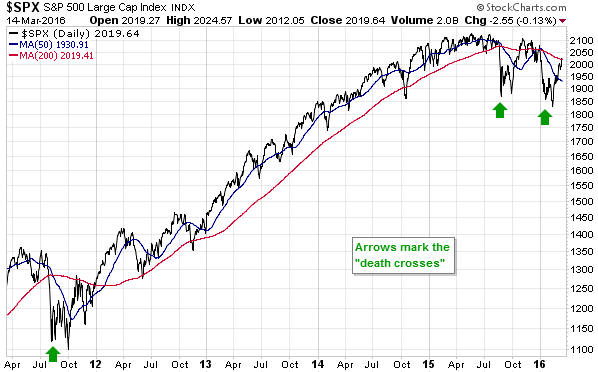
The assertion that the gold price has been successfully manipulated downward over a great many years via the relentless selling of “paper gold” contains more than a few logical and factual holes. In this brief post I’m going to highlight one of these holes.

Before I get to the main point, it’s worth pointing out that in order to sell “paper gold” there must be demand for “paper gold”, since demand for physical gold cannot be satisfied with paper claims. It is also worth pointing out that downward pressure on the price of “paper” gold that was not supported by the “physical” market would inevitably result in the price of “paper” gold making a sustained and substantial move below the price of the physical commodity, which hasn’t happened. Over the past several years the prices of gold futures contracts have generally been very close to the spot price and there have been regular small dips in futures prices to below the spot price, but this situation is a natural and predictable effect of the Fed’s unnatural zero-interest-rate policy. Taking the US$ interest-rate backdrop into account, the price of “paper” gold has generally not been lower relative to the price of physical gold than a knowledgeable observer would expect.

The main point of this post is that while gold is different from other commodities, under the current monetary system the price of gold should never become completely divorced from the prices of other commodities. In particular, the price of gold should always remain within certain bounds relative to the price of platinum.

Now, the platinum market effectively ‘lives from hand to mouth’, in that the bulk of the current year’s consumption will be satisfied by the current year’s production. It should therefore be obvious to anyone with a modicum of objectivity that it isn’t possible to manipulate the platinum price downward, beyond brief fluctuations, by selling paper claims to the commodity. As a result, the multi-decade high in the gold/platinum ratio illustrated by the following chart is evidence that if there has been a concerted attempt to suppress the gold price, it has been ineffective to put it mildly.

gold_plat_010216

I’ve come to understand that adopting the view that the gold market has been subject to a successful and long-term price suppression scheme is like adopting a child — it’s a lifetime commitment through thick and thin. I therefore don’t expect to change anyone’s opinion on this topic, but I’m hoping that some readers still have open minds.

Print This Post Print This Post