Has the Fed been a long-term success?

March 1, 2017

To know whether or not the Fed has been a long-term success, the reason for the Fed’s creation must first be known. Here is the reason from the horse’s mouth: “It [the Fed] was created by the Congress to provide the nation with a safer, more flexible, and more stable monetary and financial system.” If this is the real reason then over the long-term the Fed has not been a success. In fact, it has been an abject failure.

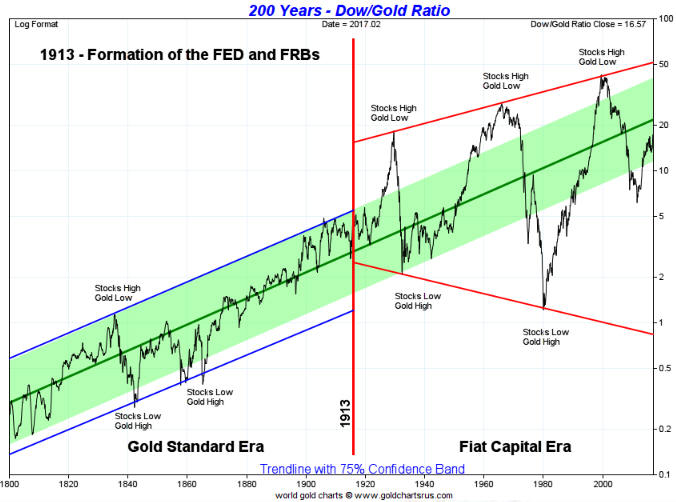
That the Fed has blatantly not been successful in providing the nation with a more stable monetary and financial system is clearly evidenced by the following ultra-long-term chart from www.goldchartsrus.com. This chart shows that the Dow/gold ratio experienced much greater long-term volatility post-Fed than it did pre-Fed.

Dow_gold_010317

This doesn’t mean that the Fed hasn’t been a success, only that it hasn’t been a success if judged based on its publicly-stated purpose.

If the Fed was actually created to ensure that the government could borrow and spend with no rigid limit and to enable the banking industry to grow its collective balance sheet far beyond what would be possible under a less ‘flexible’ monetary system, then the Fed has been a resounding success.

Bank de-regulation is less important than bank credit

February 28, 2017

[This blog post is a modified and updated excerpt from a commentary published at TSI about three weeks ago]

In response to the 2007-2009 financial crisis, policy-makers in the US who had absolutely no idea what caused the crisis enacted legislation that would supposedly prevent such a crisis from re-occurring. The legislation is called “The Wall Street Reform and Consumer Protection Act”, although it is better known as “Dodd-Frank”. Unsurprisingly, considering its origins, the Dodd-Frank legislation has done nothing to reduce financial-crisis risk but has made the US economy less efficient. Quite rightly, therefore, the Trump Administration is intent on repealing all or parts of it. What are the likely consequences?

If Dodd-Frank were scaled back in a meaningful way it could make interactions between customers and their banks more efficient, but without knowing exactly which parts of the legislation are going and which parts are staying it isn’t possible to quantify the consequences. For example, a part of the legislation that will probably go is the requirement for banks to retain at least 5% of any loans they securitise. Eliminating this requirement would be slightly helpful to banks, but would make very little difference to the overall economy.

What we can say is that the efficiency-related benefits of meaningfully scaling back Dodd-Frank would be long-term, meaning that they probably wouldn’t have a noticeable effect over the ensuing year.

As an aside, it’s worth mentioning that there is a risk associated with eliminating parts of the economy-hampering legislation known as Dodd-Frank. The risk is that de-regulation will get the blame when the next crisis occurs, and the Federal Reserve, the primary agent of economic instability, will again get away unscathed.

With regard to economic performance over the next 12 months, changes in the pace at which US banks collectively expand credit will likely be of far greater importance than changes in how the US banking industry is regulated. From a practical investing/speculating standpoint it therefore makes more sense to focus on the following chart than on the latest Dodd-Frank news.

The chart shows that after oscillating in the 7%-8% range for about 2 years, the year-over-year (YOY) rate of credit growth in the US banking industry has slowed markedly of late. As recently as late-October it was above 8%, but it’s now around 5.4%.

bankcredit_270217

The steep decline in the rate of bank credit growth during 2013 didn’t have any dramatic economic consequences, but that’s only because the Fed was rapidly expanding credit via its QE program at the time. With the Fed no longer directly adding credit and money to the financial system, keeping the credit-fueled boom alive depends on the commercial banks. In particular, there’s little doubt that a further significant decline in the rate of commercial-bank credit growth would have a noticeable effect on the economy.

On a long-term basis the effect of a further decline in the pace of credit expansion would actually be positive, but on an intermediate-term basis it would be very negative because many activities and asset prices, most notably stock prices, are now supported by nothing other than the creation of credit and money out of ‘thin air’.

The only commodity supply-demand indicator that matters

February 22, 2017

For an industrial commodity with a liquid futures market, the “term structure” of the futures market is the most useful — perhaps even the only useful — indicator of whether physical supply is tight, abundant or somewhere in between.

The term structure of a commodity futures market is the prices of futures contracts for the commodity over all available expiration months. It can be displayed as a chart, with price along the vertical axis and the expiration months along the horizontal axis. Here are examples for oil and copper.

oil_term_210217

copper_term_210217

If a market is in “contango” then the later the delivery month the higher the price, resulting in the chart of the term structure being an upward-sloping curve. If a market is in “backwardation” then the earlier delivery months will have the higher prices and the term structure will be represented by a downward-sloping curve. It is also possible for the curve representing the term structure to have an upward slope over some future delivery periods and a downward slope over others. This often happens with commodities that experience large seasonal swings in production (e.g. grains) or consumption (e.g. natural gas), but it can also happen with other commodities.

For an industrial commodity such as oil or copper it will be normal for the term-structure curve to slope upwards, that is, for the market to be in “contango”, with the extent of the “contango” reflecting the cost of physical-commodity storage. To further explain, let’s say you are a large-scale commercial consumer of oil and you estimate that you will need X barrels of the stuff in August of this year. In this case, if you don’t want to assume any price risk you can either take delivery of physical oil immediately and store it until August or buy oil for delivery in August (August-2017 oil futures). It will make sense to buy the physical oil if the cost of storage and financing is less than the premium over the spot (cash) price that you would have to pay for the August futures contracts. Otherwise, it will make sense to buy the futures and take delivery when the oil is needed in August.

It is, however, possible for a commodity such as oil to go into backwardation, that is, for the later delivery months to trade at a discount to the earlier delivery months and the spot price. Such a situation would create a risk-free profit for a commercial trader with excess oil on hand (“excess oil” being oil that will be needed by the trader in the future but isn’t needed immediately), because the trader could sell his excess physical supply on the spot market and lock-in his future supply needs by purchasing futures contracts at a discount to spot. In doing so he would not only pocket the difference between the spot and futures prices, he would also save on storage costs.

Due to the attractive arbitrage opportunity that would be presented by backwardation, it’s a situation that will usually arise only if there’s a shortage of currently-available physical supply. Backwardation, or a downward-sloping term-structure curve, is therefore a clear sign that the physical market is tight. By the same token, if the physical supply situation is genuinely tight then the market will either be in backwardation or the positive slope of the term-structure curve will be much gentler than usual.

Sometimes the term-structure curve will have a steeper upward slope than usual, that is, the later delivery months will trade at larger-than-usual price premiums to the earlier delivery months and the spot price. This will create an opportunity for traders to make risk-free profits by selling the futures and buying the physical, unless there is presently so much physical supply bidding for storage space that the price of storage is high enough to eliminate the potential arbitrage profit. Since risk-free arbitrage opportunities tend to be fleeting, a term-structure curve with a sustained steeper-than-usual upward slope indicates an abundance of currently-available physical supply.

Looking at the “term structure” charts displayed above, it is apparent that the fundamental backdrop is currently supportive for the oil price. This, by the way, constitutes a significant bullish change over the past 1-2 months. It is also apparent that the fundamental backdrop is neutral for the copper price, in that the “term structure” for the copper market has a fairly normal upward slope. The copper market appears to be adequately supplied at this time, although a more thorough analysis would take into account the LME term structure in addition to the COMEX term structure.

What about the reported inventory levels for commodities such as oil and the base metals? Is this information useful?

In general, no, because a lot of aboveground supply is not held in the storage facilities that are covered by such reports. There will be times when a relative shortage or abundance of physical supply is correctly signaled by the widely-reported inventory levels, but in such cases the evidence of shortage or abundance will also appear in the “term structure”. And the “term structure” will be more reliable, meaning that it will generate fewer false signals.

A final point worth making is that a bearish supply-demand situation doesn’t necessarily mean that the price will fall and a bullish supply-demand situation doesn’t necessarily mean that the price will rise. For example, in January-February last year I wrote that a strong rally in the oil price would probably soon begin even though oil’s supply-demand situation was as price-bearish as it ever gets. Part of my reasoning was that with the oil price having already dropped to near a 50-year low in real terms, the worst-case scenario had been factored into the current price. Also, after the fundamentals become as bearish (or bullish) as they ever get, what’s the most likely direction of the next move?

Trump will not really cut taxes

February 20, 2017

As the financial world waits with bated breath for details of Donald Trump’s “phenomenal” tax plan, it’s important to understand that regardless of what Trump announces on the tax front there will be no genuine tax cut. The reason is that for a tax cut to be genuine it must be funded by reduced government spending.

Tax cuts are unequivocally beneficial to the economy if they are genuine, but if a tax cut isn’t funded by reduced government spending, that is, by the government consuming less resources, then one way or another it will have to be funded by the private sector. It will just be another Keynesian stimulus program, and like all Keynesian stimulus programs it will potentially boost economic activity in the short-term at the cost of slower long-term progress.

It should be obvious that the private sector cannot benefit from a tax cut that it will have to pay for, but apparently it isn’t obvious because most people seem to believe that the government can consume more resources and at the same time the private sector can end up with more resources. This is an example of believing the impossible. Unfortunately, it’s not the only such example in the world of economics, in that many aspects of Keynesian theory involve belief in the impossible.

The cost of government is determined by what the government spends, not how much it collects in taxes. And we can be sure that during the next four years there is going to be a large rise in the cost of the US federal government, meaning that with or without a so-called tax cut the private sector (as a whole) is destined to end up with reduced resources under the Trump regime. We can also be sure that it would have ended up with reduced resources under a Clinton regime.

The reason, as explained in the article posted at http://crfb.org/papers/lame-duck-president-2017, is that spending increases in excess of revenue increases were ‘baked into the cake’ prior to the November-2016 Presidential election thanks to budgets dictated by previous presidents and Congresses. Getting a little more specific, the linked article points out that 150 percent of new revenue a decade from now is pre-committed to spending growth scheduled under laws that were in place prior to the 2016 election. Moreover, this should be viewed as an unrealistically-optimistic forecast because it assumes steady inflation-adjusted revenue growth. A more realistic forecast would account for the sizable decline in inflation-adjusted revenue that will be caused by a recession within the next few years.

The bottom line is that any cuts in the rates of US individual and corporate income taxes announced/implemented over the coming 12 months will be ‘smoke and mirrors’, because government spending is going to increase. It will essentially be a money-shuffling exercise to temporarily create the illusion that the burden of government is shrinking at the same time as it is growing.