Uranium’s stealth upward trend

March 4, 2019

It’s likely that by the middle of the next decade, most new cars, trucks and buses will be Electric Vehicles (EVs). As a consequence, it’s a good bet that over the next several years the demand for both gasoline and diesel will shrink dramatically while the demand for electricity (to recharge EV batteries) experiences huge growth. Part of this demand growth will be satisfied by nuclear power, which is why uranium is an indirect play on the EV trend.

The uranium price might have begun to discount the aforementioned shift in demand in that it has been quietly trending upward since around April of last year (a weekly chart is displayed below). I say “quietly” because the rally has been accompanied by very little in the way of speculative enthusiasm. On the contrary, the rally that began last April has been accompanied by widespread scepticism.

This is an important sentiment change. Whereas every multi-month up-move in the uranium price prior to last year was greeted as if it heralded the beginning of a bull market, almost everyone has dismissed the most recent rally as just another counter-trend bounce. Being bearish on uranium has become easy, but bull markets begin when it’s easy to be bearish.

uranium_040319

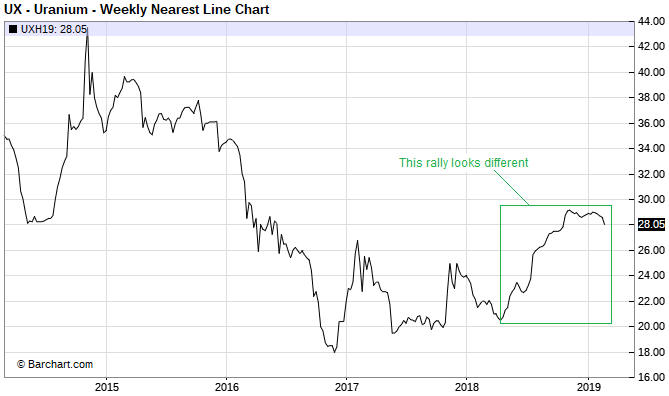
I’m not convinced that a uranium bull market is underway, but I do think that for the uranium-mining sector the intermediate-term risk/reward is skewed decisively towards reward. The reason is that the mining stocks could achieve large price gains with or without a genuine bull market in the underlying commodity. All it would take, I think, is a move by the uranium price into the $30s to convince many speculators that a major trend reversal had occurred and prompt aggressive buying of uranium-mining equities.

It used to be that owning shares of the Global X Uranium Fund (URA) was the simplest and surest way of participating in a uranium-mining rally, but that is no longer the case due to the changes that were made to this fund last year. As outlined HERE, during the second quarter of last year the index that URA tracks was changed from the Solactive Global Uranium Total Return Index to the Solactive Global Uranium & Nuclear Components Total Return Index. Thanks to this change, seven of URA’s current top ten holdings have no correlation with the uranium price.

Nowadays, owning the shares of Cameco (CCJ) is the surest way of participating in a uranium-mining rally.

It looks to me like CCJ is not far from completing a 3-year base (see chart below). I like the idea of gradually building up a position on weakness while the basing process continues.

CCJ_040319

What the Fed is doing: perception versus reality

February 26, 2019

[This blog post is an excerpt from a TSI commentary published on 24th February]

Based on the par value of maturing securities on its balance sheet there was scope for the Fed to withdraw as much as $43B from the financial markets on 15th February. A week ago we noted that this ‘liquidity drain’ had no effect on the stock market, possibly because the effect would occur on the next trading day (Tuesday 19th February) or because the Fed chose to withdraw a lot less money than it could have. Now that the Fed has issued its latest weekly balance sheet update we can see why there was no effect from this potential bout of “quantitative tightening” (QT). We can also see that the general perception of what the Fed is doing has deviated in a big way from what the Fed actually is doing.

During the 7-day period from 13th to 20th February the Fed’s securities portfolio fell by $31B. In other words, the Fed implemented $31B of a potential maximum $43B of QT. Over the same period, however, the amount of money in the US federal government’s account at the Fed fell by $44B. This means that there was a $31B withdrawal of liquidity by the Fed in parallel with a $44B injection of liquidity by the government, resulting in a net liquidity ADDITION of $13B. No wonder there wasn’t a noticeable negative effect on the stock market from the Fed’s actions.

The difference between a Fed liquidity injection and a government liquidity injection is that whereas the Fed can inject new money, the government can only recycle existing money (the government returns to the economy the money it previously removed via borrowing or taxation). Government liquidity injections therefore are not inflationary, but their short-term effects can be similar to Fed liquidity injections.

Note that at 20th February the government had about $330B in its account at the Fed. This means that the government currently has the ability to inject up to $330B into the economy, but depending on the size of its desired cash float it may or may not make additional injections in the short-term.

Also note that notwithstanding all of the ‘dovish’ talk that has emanated from the Fed over the past two months, the QT program has continued. From 2nd January to 20th February the Fed removed $63B from the economy as part of its “balance sheet normalisation”. The pace of the liquidity removal is slower than the Fed’s self-imposed $50B/month limit, but it is not correct to say — as some pundits have said — that the Fed has stopped tightening. The Fed is still pulling on the monetary reins.

That the Fed is still tightening means that there is a substantial mismatch at the moment between perception and reality. The general perception is that the Fed is now either on hold or preparing to loosen, but, as mentioned above, this most definitely is not the case. Consequently, bullish speculators in the stock, commodity and gold markets are getting ahead of themselves.

It’s possible that the Fed will end its monetary tightening within the next few months, but that’s only going to happen if there’s another pronounced shift away from risk. To put it another way, the more the markets discount an easing of monetary policy the less chance the easing will occur. In fact, if the stock market extends its upward trend into May-June then the Fed probably will resume its rate-hiking in June.

Gold generally does what it is supposed to do

February 18, 2019

Like every other financial market in world history, the gold market is manipulated. However, anyone who believes that manipulation of the gold market is an important influence on major gold-price trends does not understand the true fundamental drivers of the gold price.

To paraphrase Jim Grant, gold’s market value is the reciprocal of confidence — in the banking system (including the central bank), the economy and the government. In other words, gold should do relatively well when confidence is on the decline and relatively poorly when confidence is on the rise.

By comparing the gold/commodity ratio with measures of monetary and/or economic confidence it can be shown that gold generally does exactly what it should do. There are periods of divergence, but these tend to be short (no more than a few months) and barely noticeable on long-term charts.

The point outlined above can be illustrated by comparing the gold/commodity (gold/GNX) ratio with the IEF/HYG ratio, which I’ve done in the following chart.

The IEF/HYG ratio is fit for our purpose because it is a measure of what’s happening to credit spreads, and because the economy-wide credit-spread trend is one of the best indicators of economic confidence. Specifically, the IEF/HYG ratio increases when credit spreads are widening (indicating declining economic confidence) and decreases when credit spreads are narrowing (indicating rising economic confidence).

Therefore, it is fair to say that the following chart compares the gold/commodity ratio with the reciprocal of confidence in the US economy.

Lo and behold, the two lines on the chart track each other quite closely.

goldGNX_creditsp_180219

The absurdity known as “TARGET2”

February 11, 2019

[This blog post is an excerpt from a commentary posted at TSI about three weeks ago]

TARGET2 is the system set up in the euro-zone to clear inter-bank payments. The Bundesbank (Germany’s central bank) describes it as a payment system that enables the speedy and final settlement of national and cross-border payments. The problem is that often there is no “final settlement” under TARGET2. Instead, credits and debits can build up indefinitely.

To understand the issue it first must be understood that although the 19 countries that comprise the euro-zone use a common currency, the euro-zone isn’t really a unified monetary system. It is more like 19 separate monetary systems, each of which is overseen by a National Central Bank (NCB). These NCBs are, in turn, overseen and coordinated by the ECB. TARGET2 is the means by which money is transferred quickly and efficiently between these 19 separate monetary systems. The transfer may well be quick and efficient, but, as noted above, it often doesn’t result in final settlement.

Further explanation is provided by the Bundesbank, as follows:

…both the Bundesbank and the Banque de France will be involved in a cross-border payment transaction made in settlement of a German export to France, for instance. That transaction begins when the French importer’s commercial bank in France debits the purchase amount from the importer’s account and submits a credit transfer in TARGET2 to the German exporter’s commercial bank in Germany. The Banque de France then debits the amount from the TARGET2 account it operates for the French commercial bank and posts a liability owed to the Bundesbank. For its part, the Bundesbank posts a claim on the Banque de France and credits the amount to the German commercial bank’s TARGET2 account. The transaction is concluded when the commercial bank credits the amount in question to the account it operates for the German exporter.

At the end of the business day, all the intraday bilateral liabilities and claims are automatically cleared as part of a multilateral netting procedure and transferred to the ECB via novation, leaving a single NCB liability to, or claim on, the ECB.

Viewed in isolation, the transaction used as an example above leaves the Banque de France with a liability to the ECB and the Bundesbank with a claim on the ECB at the end of the business day. These claims on, or liabilities to, the ECB are generally referred to as TARGET2 balances.

The example given above by the Bundesbank refers to a German export to France, but the same process would apply when someone transfers money from a bank deposit in one EZ country to a bank deposit in another EZ country. For example, the electronic wiring of funds from a commercial bank account in Italy to a commercial bank account in Luxembourg would leave the Banca d’Italia with a liability to the ECB and the Banque Centrale du Luxembourg with a claim on the ECB.

The process described above means that there is never any net clearing of cross border payments at the NCB level. Unless the money flowing in one direction (into Country X) equals the money flowing in the opposite direction (out of Country X), credit/debit balances will build up and there is no limit to how large these balances can become.

As illustrated by the following chart from Yardeni.com, this is not just a hypothetical issue. The NCBs of some EZ countries, most notably Germany and Luxembourg, now have huge positive TARGET2 balances, and the NCBs of some other EZ countries, most notably Italy and Spain, now have huge negative TARGET2 balances.

As at October-2018, the central bank of Germany was owed 928 billion euros by the TARGET2 system, while together the central banks of Italy and Spain owed 887 billion euros to the TARGET2 system. Is this a problem?

The system is so strange that there doesn’t appear to be a clear-cut answer to the above question, at least not one that we can fathom. It could be a huge problem or it could be no problem at all.

The Bundesbank is sitting there with an asset valued at almost 1 trillion euros that will never pay any interest and cannot be collected. At first blush this appears to be a huge problem. It implies that at some point the asset will have to be written off, perhaps leading to a very expensive bailout funded by German taxpayers. But then again, due to the way the current monetary system works it may well be possible for TARGET2 balances to grow indefinitely with no adverse consequences. That’s why we haven’t devoted any commentary space to this issue in the past.

If we were forced to give an answer to the above question it would be that rising interest rates, burgeoning government debt levels and private bank failures will become system-threatening issues in the EZ long before the TARGET2 balances pose a major threat.