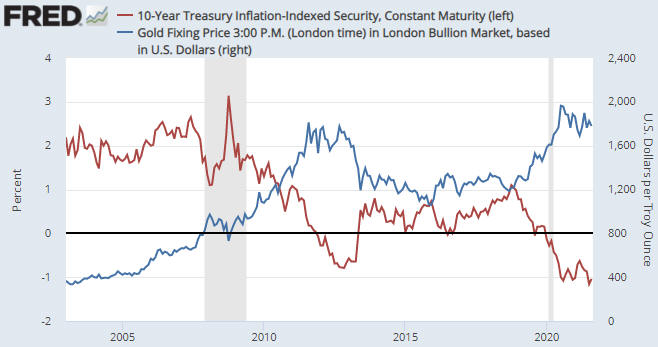
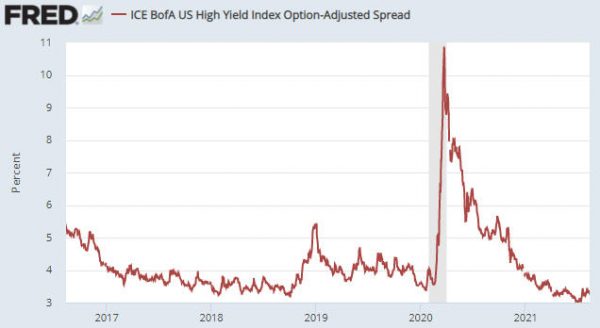
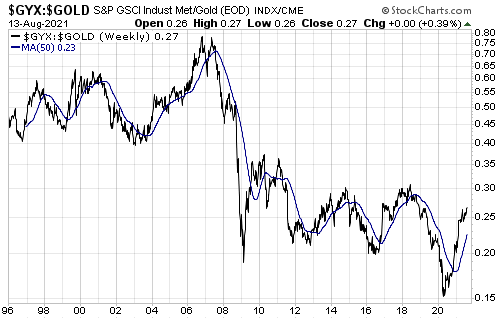
The measuring stick is critical when determining whether an asset is in a bull market. If a measuring stick is losing value at a fast enough pace, then almost everything will appear to be in a bull market relative to it. For example, pretty much everything in the world has been rising in value rapidly over the past several years when measured in terms of the Venezuelan bolivar. It should be obvious, though, that not everything can be simultaneously in a bull market. To determine which assets/investments are in a bull market we can’t only go by performance relative to any national currency; we must also look at the performances of assets/investments relative to each other.
That’s where the gold/SPX ratio (the US$ gold price divided by the S&P500 Index) comes in handy. Gold and the world’s most important equity index are effectively at opposite ends of the ‘investment seesaw’. Due to their respective natures, if one is in a long-term bull market then the other must be in a long-term bear market. In multi-year periods when they are both trending upward in dollar terms it means that the dollar is in a powerful bear market, not that gold and the SPX are simultaneously in bull markets.
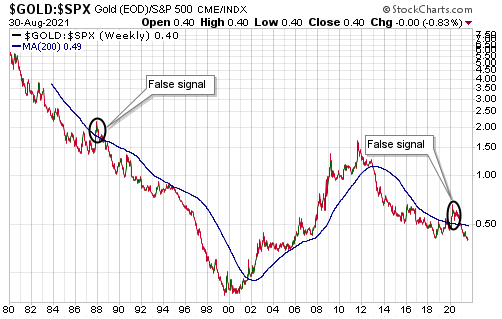
The following weekly chart removes the US$ from the equation and measures gold against its main competition (the SPX). The blue line on the chart is the 200-week MA. In the past, crosses through the 200-week MA by the gold/SPX ratio have been useful in confirming changes to gold’s long-term trend, although there were two false signals (October-1987 and March-2020) that resulted from stock market crashes.
The chart shows that the gold/SPX ratio recently broke below its 2018 low and is at its lowest level of the past 15 years. This implies that the gold bear market that began in 2011 has not ended.
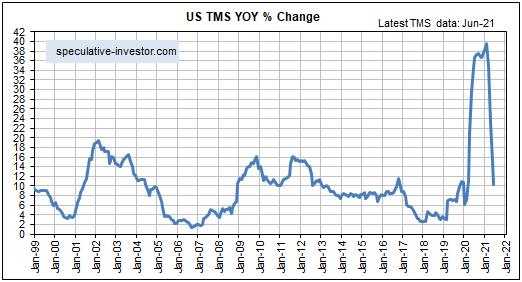
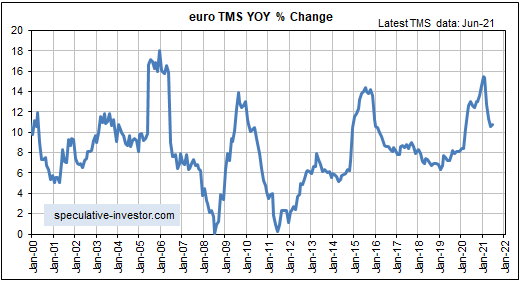
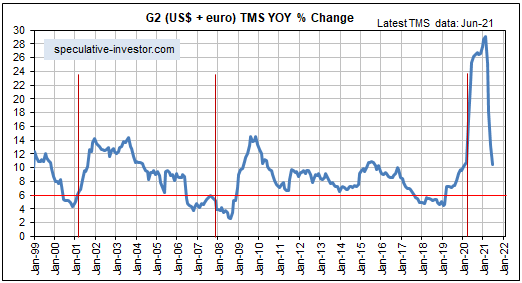
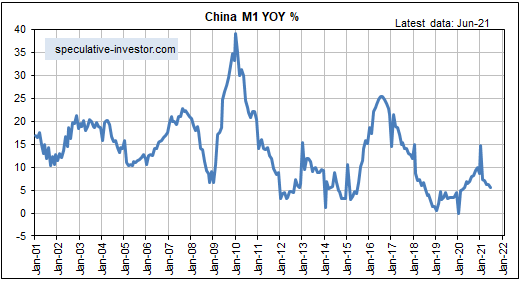
Over the past 12 months a monetary-inflation-fuelled economic boom has been in full swing. This is not the sort of environment in which gold should perform well. On the contrary, gold tends to come into its own after a boom starts to unravel, that is, after a boom-to-bust transition gets underway. This could happen during the first half of next year.
 Print This Post

