The global boom/bust indicator

September 5, 2014

The gold market is generally weak relative to the industrial metals markets during the boom phase of the inflation-fueled, central-bank-sponsored boom/bust cycle and strong relative to the industrial metals markets during the bust phase of the cycle. In other words, the gold/GYX ratio (gold relative to the Industrial Metals Index) tends to fall during the booms, which are periods when economic confidence rises while mal-investment sets the stage for an economic contraction, and rise during the busts, which are periods when the mistakes of the past come to the fore. This is due to gold’s historical role as a store of purchasing power and a hedge against uncertainty.

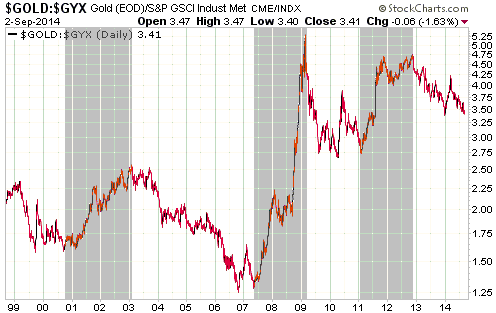
By shading the bust periods in grey, I’ve indicated the global booms and busts on the following chart of the gold/GYX ratio. During the 16-year period covered by the chart there have been three busts: the recession of 2001-2002 that followed the bursting of the NASDAQ bubble, the global financial crisis and “great recession” of 2007-2009, and the euro-zone sovereign debt and banking crisis of 2011-2012.

The booms tend to fall apart more quickly than they build up, so the rising trends in the gold/GYX ratio tend to be shorter and steeper than the falling trends.
gold_GYX_030914

Gold/GYX’s current situation looks most similar to Q2-2007. At that time the ratio tested its late-2006 bottom and then reversed upward, marking the end of the boom that began in 2003. However, gold will soon have to start strengthening relative to industrial metals such as copper in order for the 2007 similarity to be maintained. If this doesn’t happen and the gold/GYX ratio breaks decisively below its December-2013 bottom, it will indicate that the boom is going to extend into 2015.

I want to stress that gold’s relationship to the boom/bust cycle is primarily about its performance relative to other commodities, especially the industrial metals. It is not about gold’s performance in US$ terms. For example, from mid-2005 through to mid-2006 gold performed poorly relative to the industrial metals, but this was a good time to be long gold and a very good time to be long gold stocks. It’s just that the industrial metals handily outperformed gold during this period, which makes sense considering the global economic and financial-market backdrop at the time. For another example, from May through November of 2008 gold performed extremely well relative to the industrial metals. This makes sense considering the global economic and financial-market backdrop of the period, but it was a bad time to be long gold and a very bad time to be long gold stocks.

Print This Post Print This Post

The “Widowmaker Trade”

September 1, 2014

Over the past 15 years there have always been very compelling reasons to short Japanese Government Bonds (JGBs), but almost everyone who has attempted to make money by shorting JGBs has ended up losing money. The consistency with which bearish JGB speculators have lost money over a great many years led to the short-selling of JGBs becoming known as the “widowmaker trade” and spawned the saying: “you can’t claim to be a speculator until you’ve lost money shorting JGBs”.

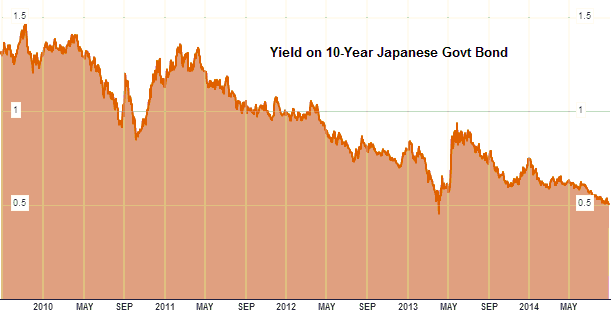
As evidenced by the steady downward trend on the following Bloomberg.com chart of the 10-year JGB yield, anyone who has attempted to short the JGB since the beginning of this year has lost money. In other words, the “widowmaker trade” is still living up to its name. Moreover, with the exception of a few days during early-April of last year, the 10-year JGB yield has never been lower than it is right now.

JGByield

Actually, despite the steady upward grind in price and downward grind in yield, I doubt that many speculators have lost money shorting JGBs this year. The reason is that the market for JGBs no longer functions like a real market. It has effectively been squashed by the gigantic boot of the Bank of Japan (BOJ).

Due to the BOJ’s policy of buying-up every piece of government debt it can get its hands on, the JGB is so over-priced that there are no buyers apart from the BOJ. At the same time, nobody in their right mind would bet against a high-priced investment that was being supported by a totally committed buyer with infinitely deep pockets. Consequently, for all intents and purposes the JGB market is dead.

Given the proclivity of the US monetary authorities to copy Japan’s worst policy choices, speculators who believe that they will make a fortune over the years ahead by shorting US government bonds should probably re-think their stance. After all, if a Keynesian remedy fails dismally in Japan, it can only be because the remedy wasn’t implemented aggressively enough.

Print This Post Print This Post

Interest rate suppression stupidity

September 1, 2014

It is illogical to expect an artificially-low interest rate to help the economy. This is because the best-case scenario resulting from interest-rate suppression is a wealth transfer from savers to speculators. In other words, the best case is a ‘wash’ for the overall economy. The realistic case, however, is very much a negative for the overall economy, because in addition to punishing savers an artificially low interest rate will cause mal-investment and thus make the economy less efficient.

Furthermore, thanks to the Japanese experience of the past two decades there is now a mountain of recent empirical evidence to support the logic outlined above. Japan’s policymakers have tried and tried again to propel their economy to the mythical “escape velocity” by pushing interest rates down to absurdly low levels and keeping them there, but every attempt has failed. Unfortunately, the fact that interest-rate suppression has been a total bust in Japan has not dissuaded other central banks from going down the same path.

The root of the problem is devotion to bad economic theory. If you are convinced that lowering the interest rate, pumping money into the economy and ramping-up government spending is beneficial, then from your perspective a failure of such measures to sustainably boost the rate of economic growth can only mean that the measures weren’t aggressive enough. If the interest rate is reduced to zero and the economy remains sluggish, then a negative interest rate must be needed. If the economy doesn’t become strong in response to 10% annual money-supply growth, then 15% or 20% annual monetary expansion is obviously required. If a hefty boost in government spending fails to kick-start the economy, then it must be the case that government spending wasn’t boosted enough.

The alternative is that the theory underlying the policy is completely wrong, but this possibility must never be acknowledged.

Print This Post Print This Post

Still not much monetary inflation in Japan

August 22, 2014

A popular view is that the Bank of Japan (BOJ) is inflating the Yen to oblivion. This view is wrong. The reality is that while there is certainly a risk that the BOJ will eventually inflate Japan’s money supply at a fast pace, it is not currently doing so.

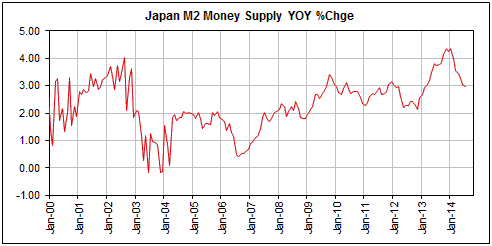
The spectacular QE program introduced by the BOJ in April of last year did have some effect on the money supply, but the effect was nowhere near as great as generally believed. As illustrated by the chart displayed below, the year-over-year (YOY) rate of increase in Japan’s M2 money supply rose from around 3% in early-2013 to just above 4% near year-end, but 4% is a long way from the explosive growth that most analysts thought would result from the BOJ’s new Yen-depreciation policy. Furthermore, the YOY rate of increase in Japan’s M2 has since drifted down to 3% and appears to be on its way back to the long-term average of 2% (I think it will be back at 2% by October). This means that Japan is still maintaining the world’s lowest monetary inflation rate, which prompts me to ask: Why are so many analysts still blindly assuming that the BOJ is rapidly expanding the Yen supply? Why aren’t they spending the 15 minutes that would be needed to validate — or in this case invalidate — their assumptions by checking the money-supply figures available at the BOJ web site?

An implication of the above is that the supply side of the Yen’s supply-demand equation remains bullish for the Yen’s exchange rate. However, for most currency traders this doesn’t matter. The reason is that the supply side dominates very long-term trends in the foreign exchange market, but the demand side often dominates over periods of up to 2 years.

Print This Post Print This Post